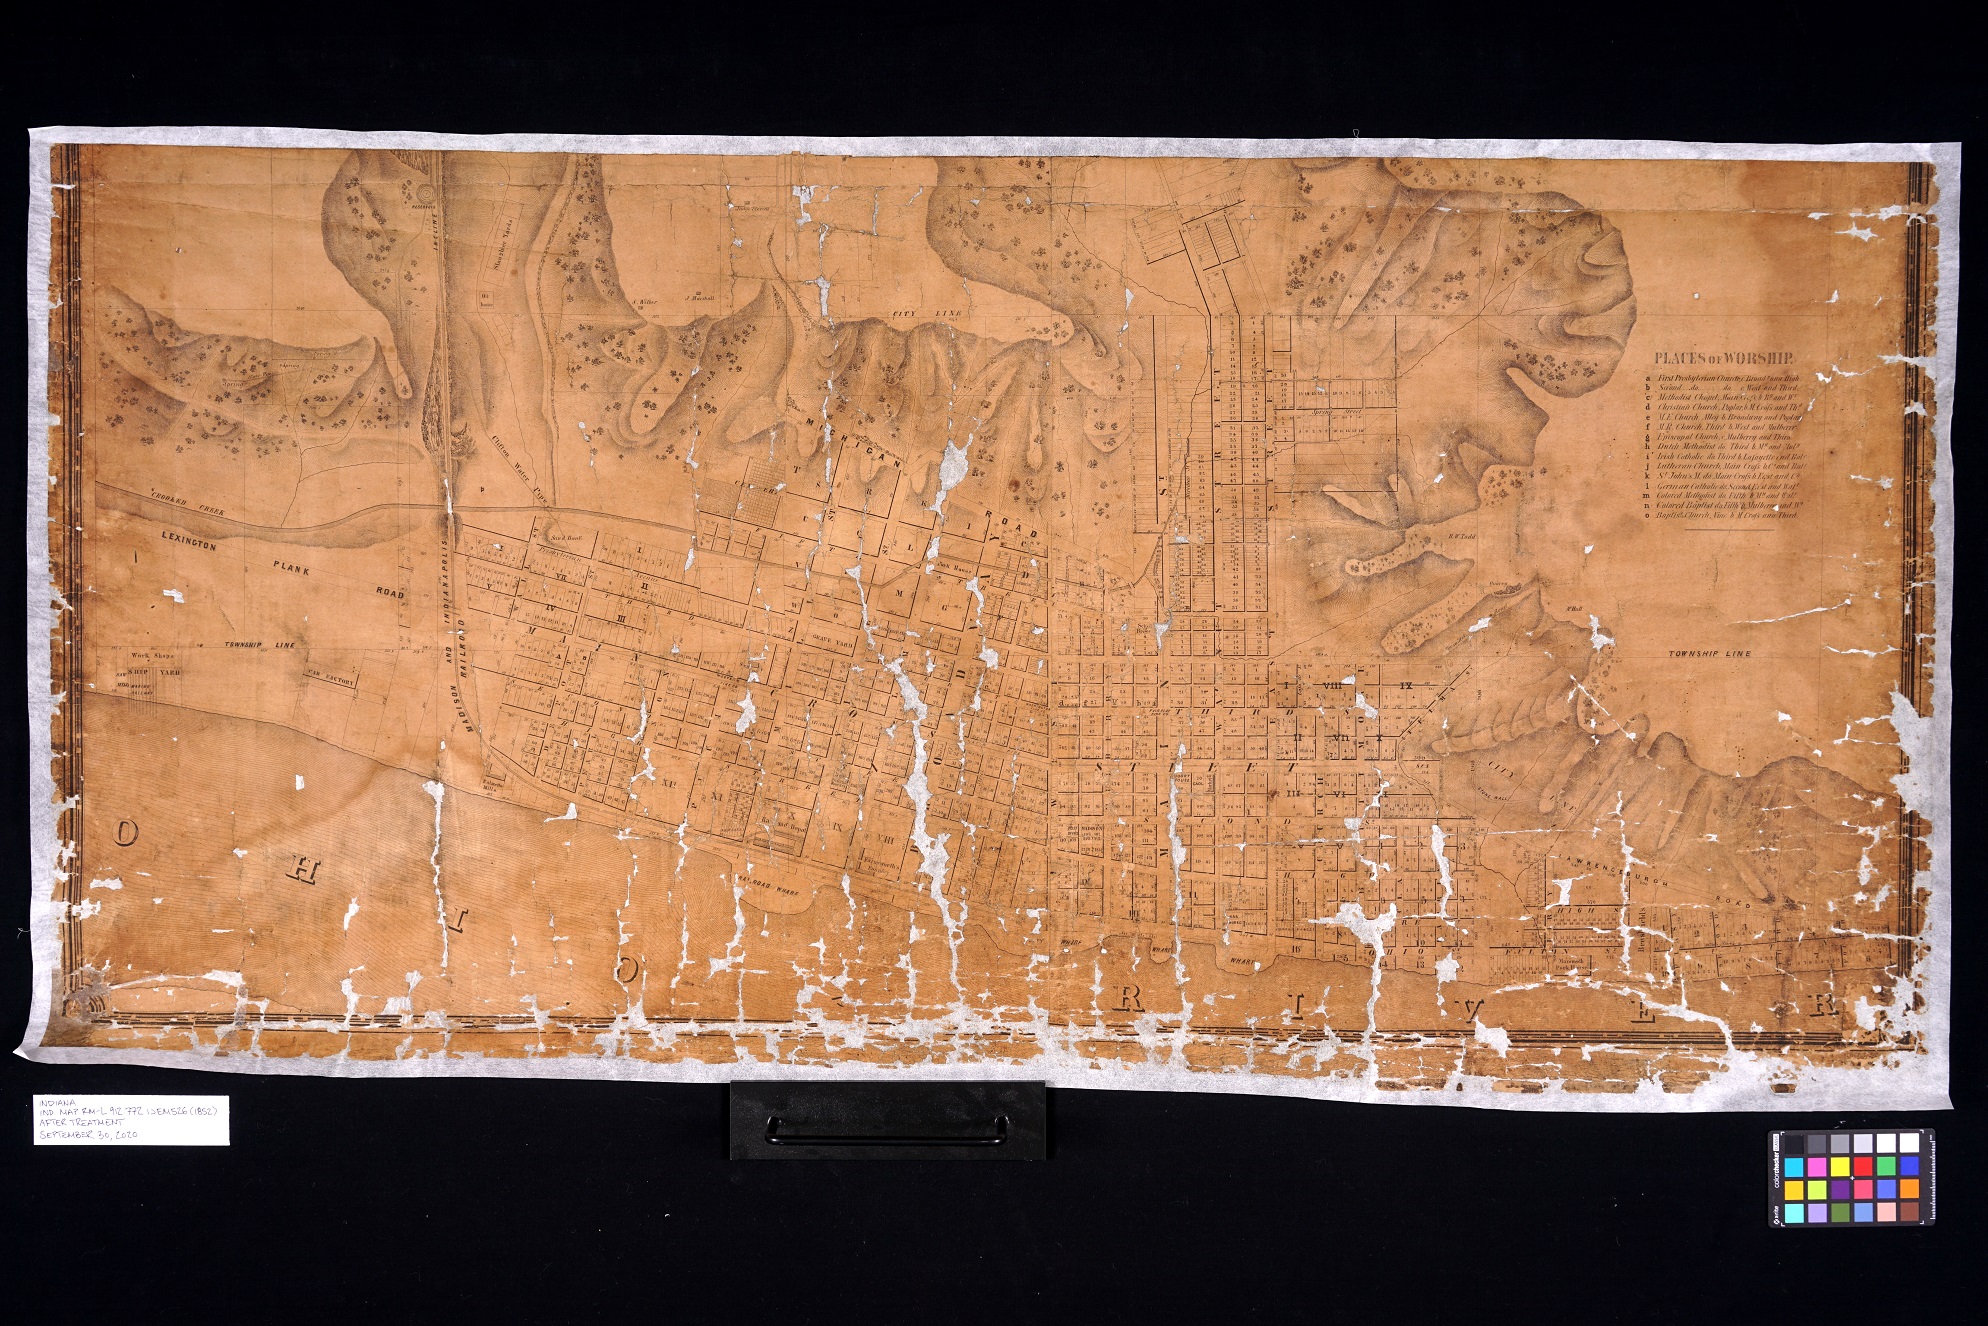
The United States Land Ordinance of 1785 marked the beginning of cadastral surveys in this country, the official way of preparing U.S. land to be registered for ownership. Surveyors used a rectangular survey system to divide land into townships measuring six miles squared, containing about 23,000 acres of land each. Jill Weiss Simins, of the Indiana Historical Bureau, details the history of surveying in the U.S. and its impact on Native Americans in her blog post, Democracy for Some: Defining the Indiana Landscape through the Rectangular Survey System. The ordinance established the nation’s Public Land Survey System as a replacement for metes-and-bounds surveys.
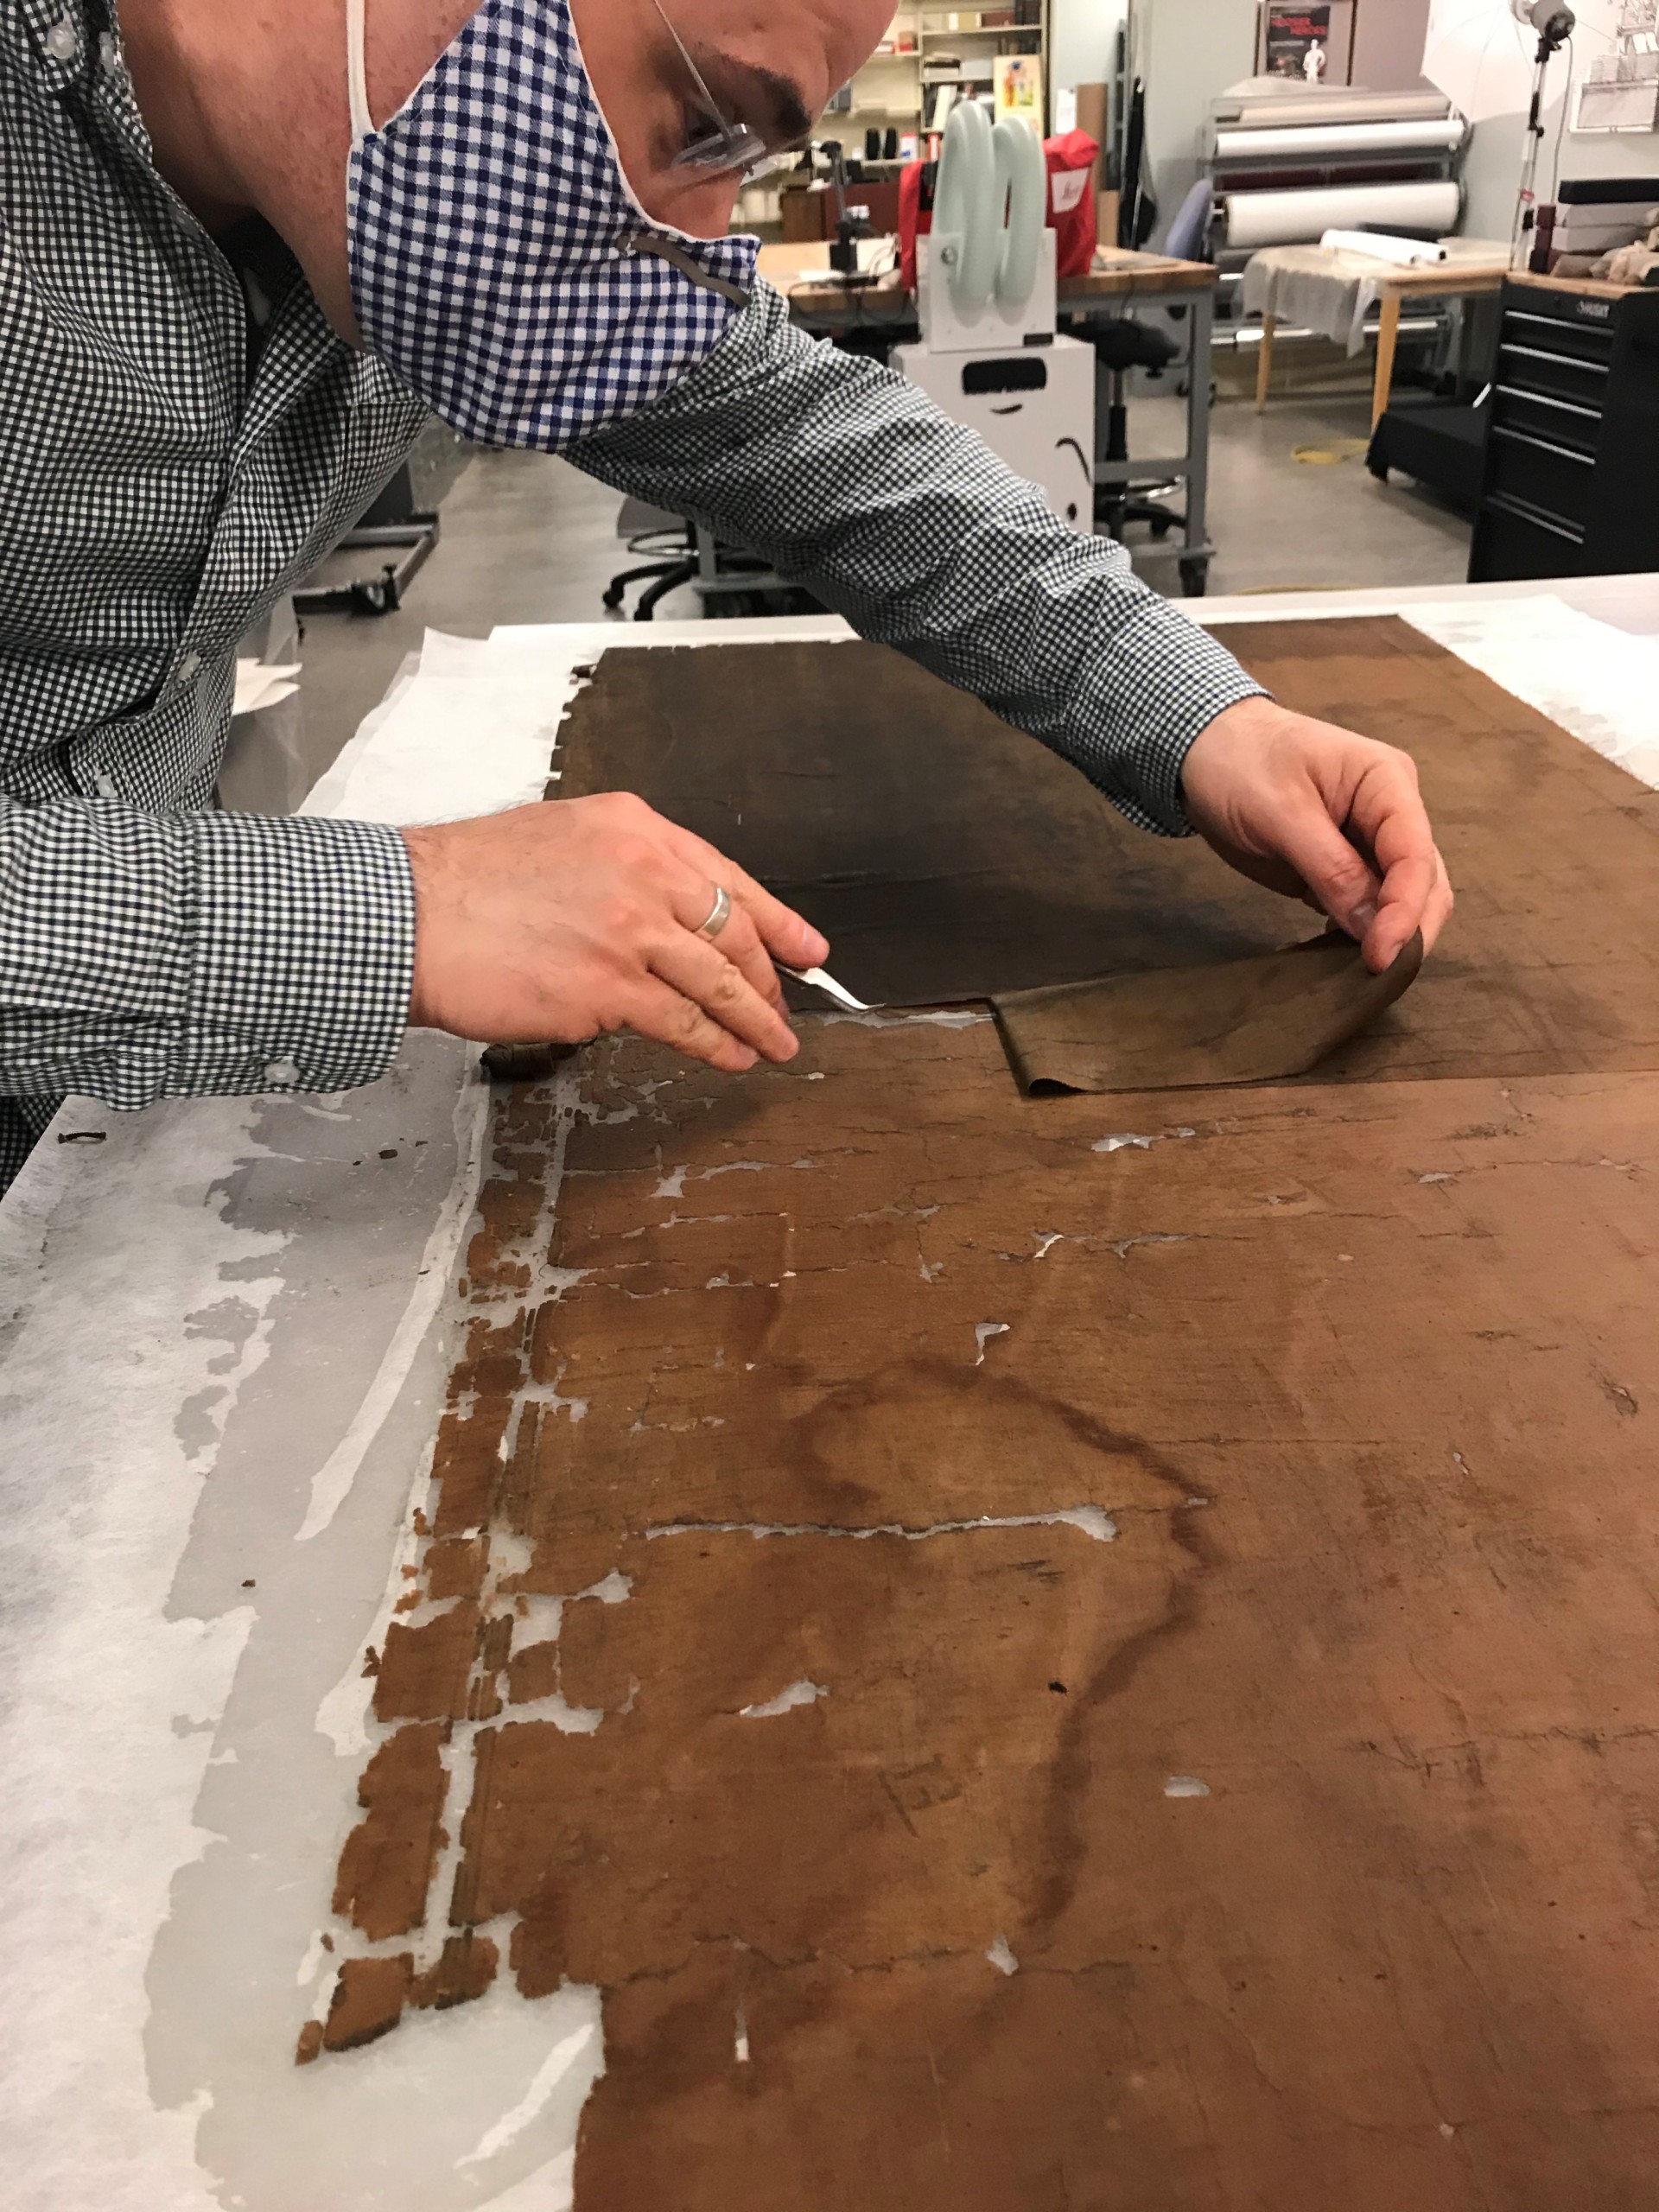
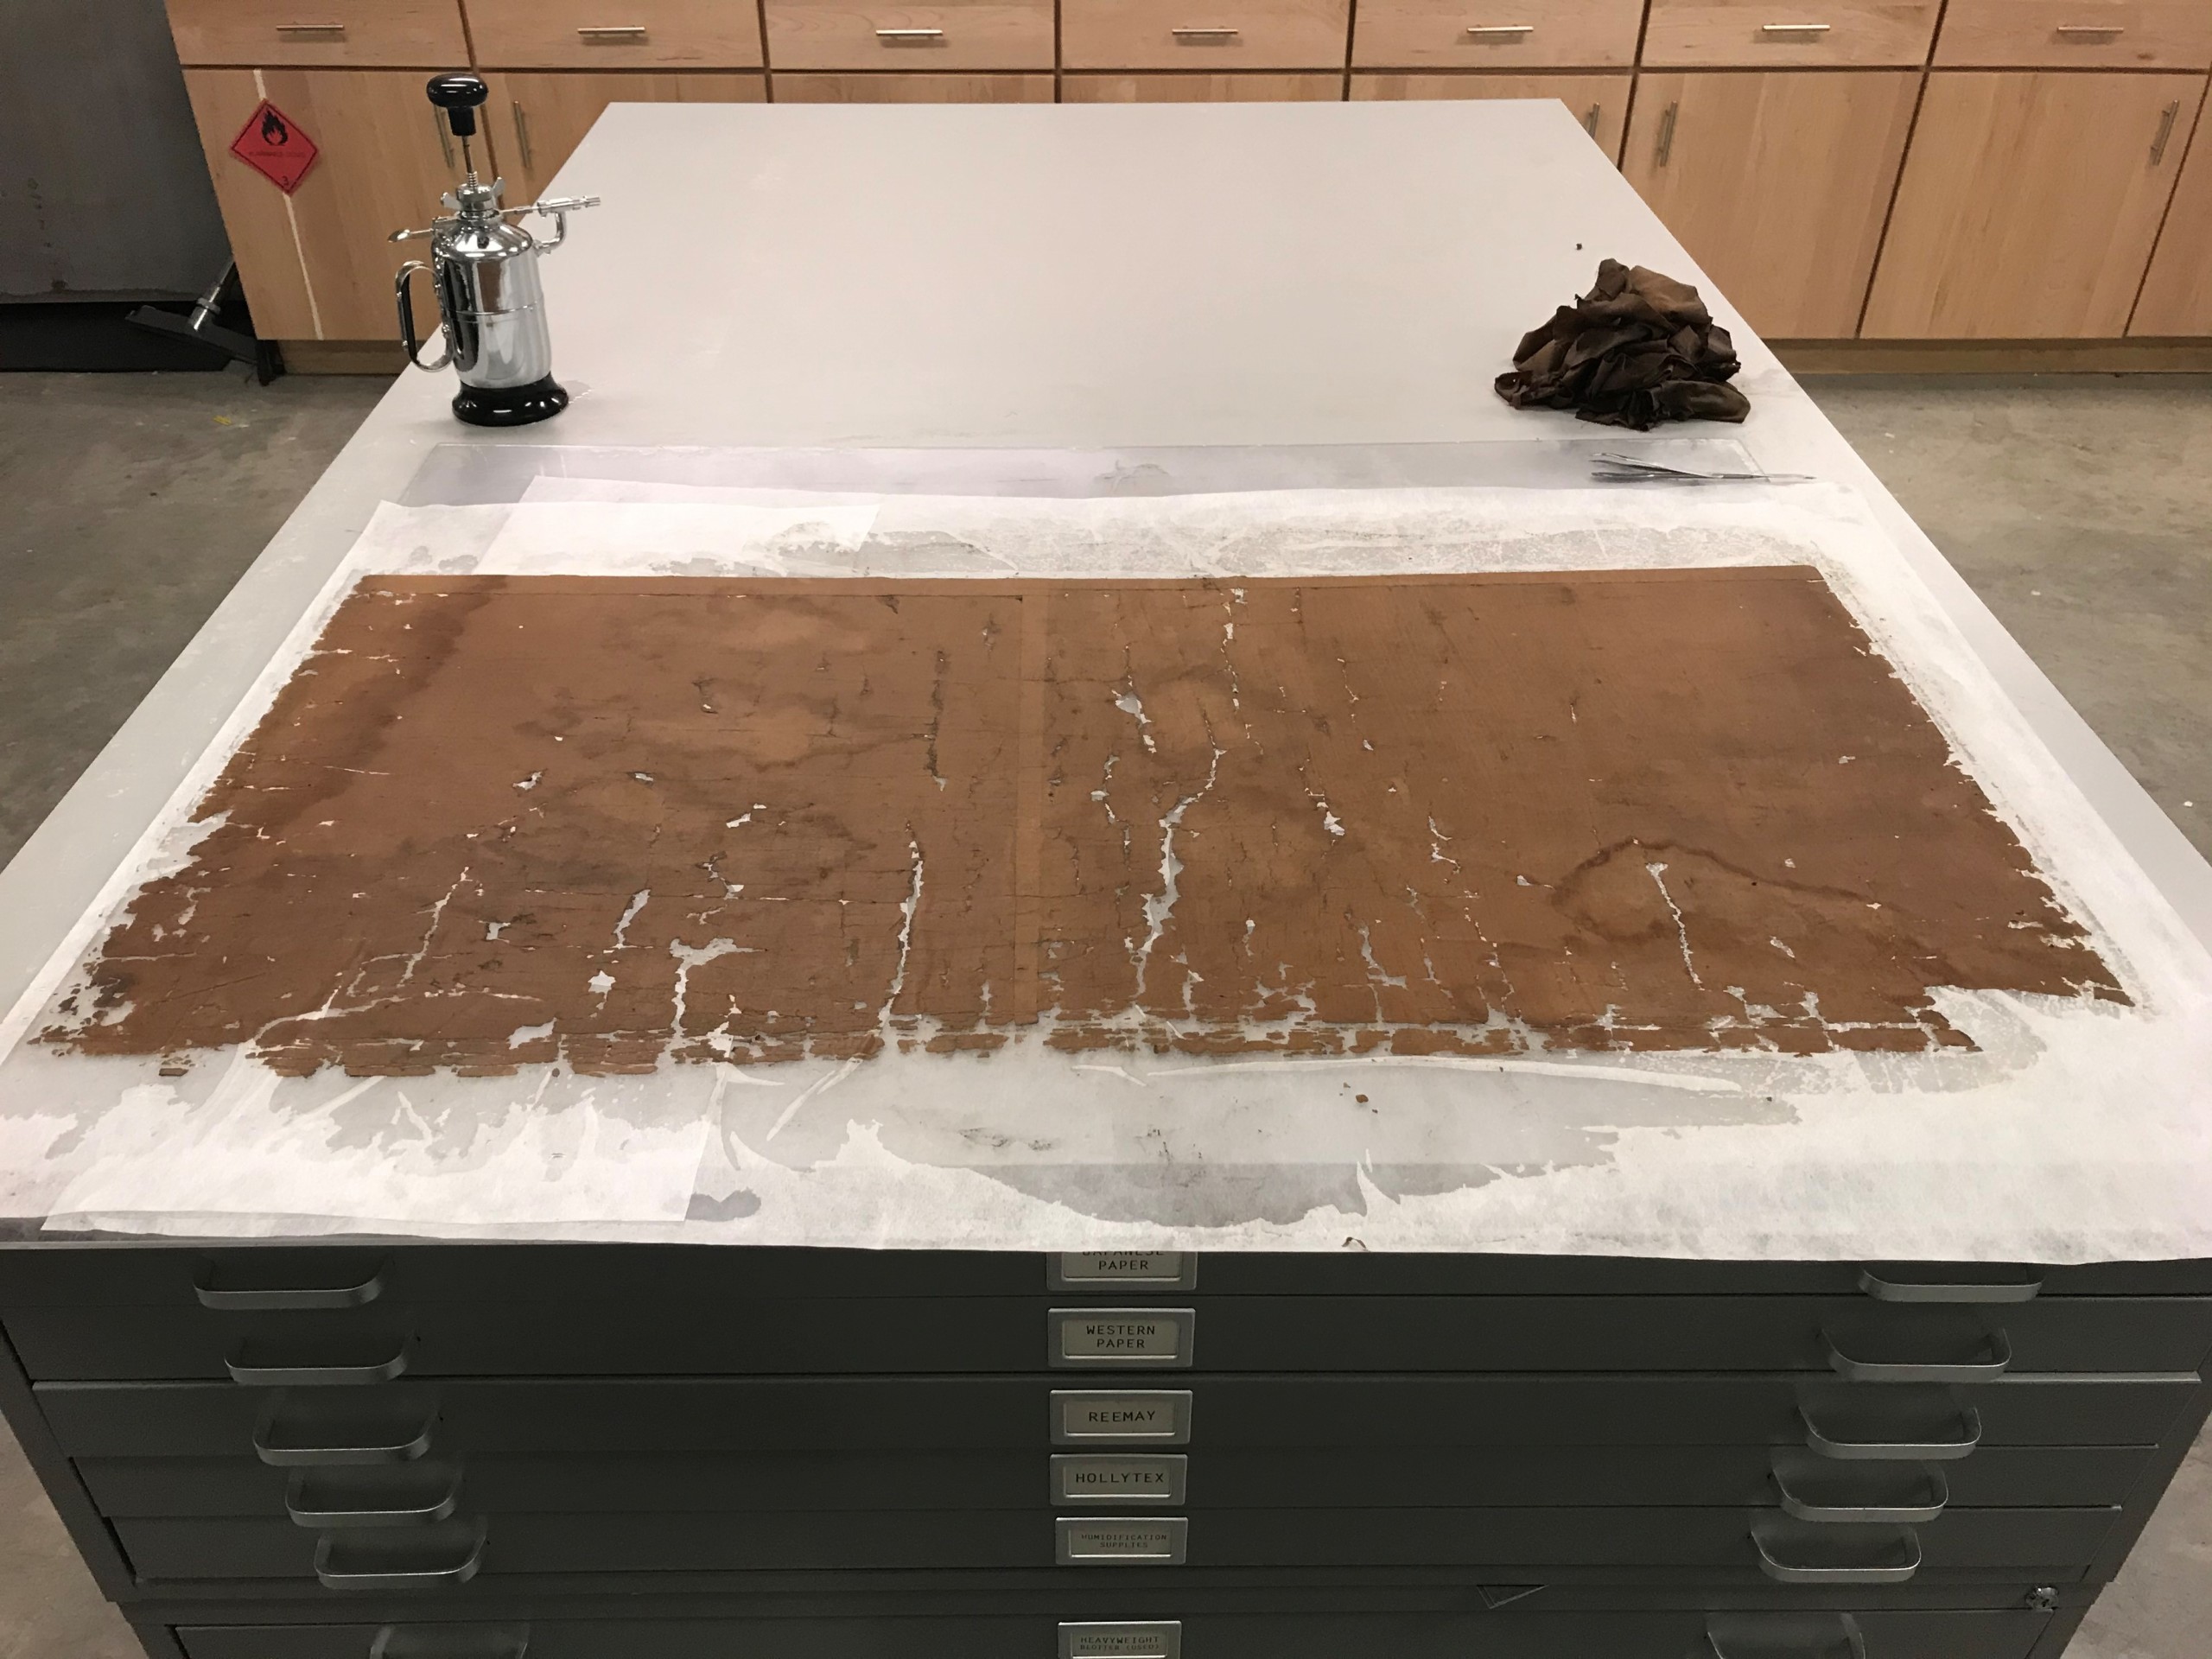
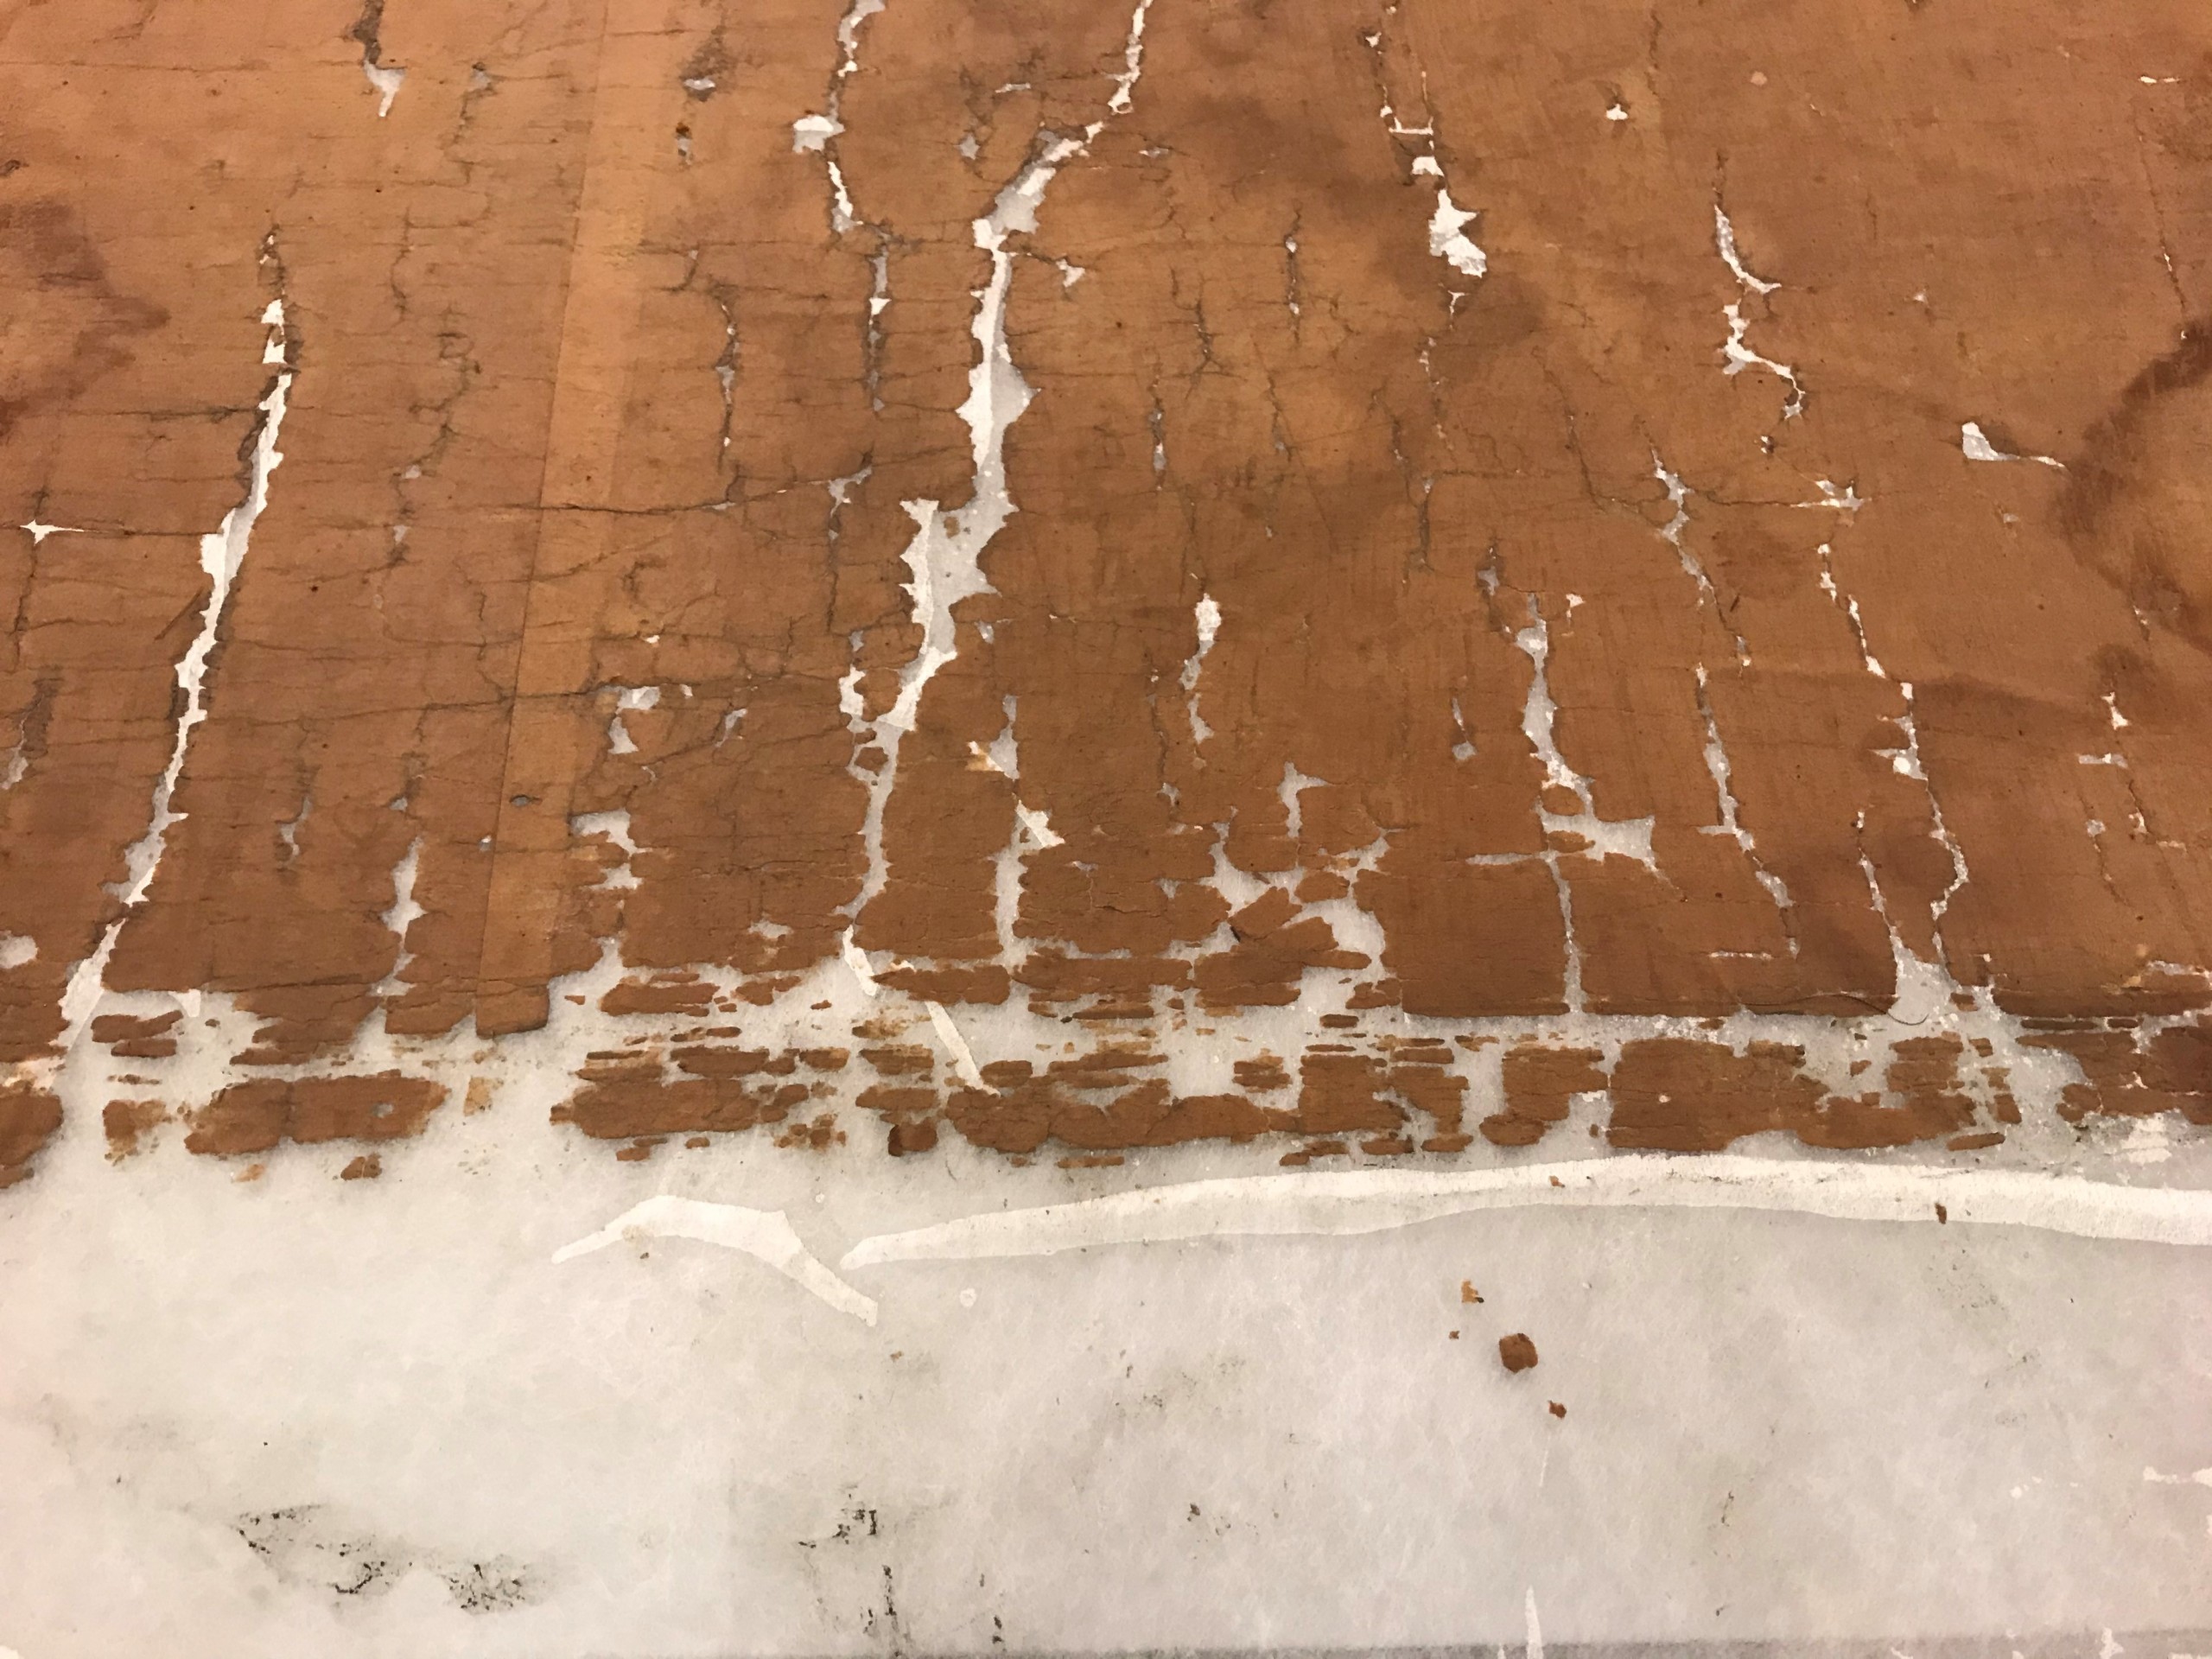
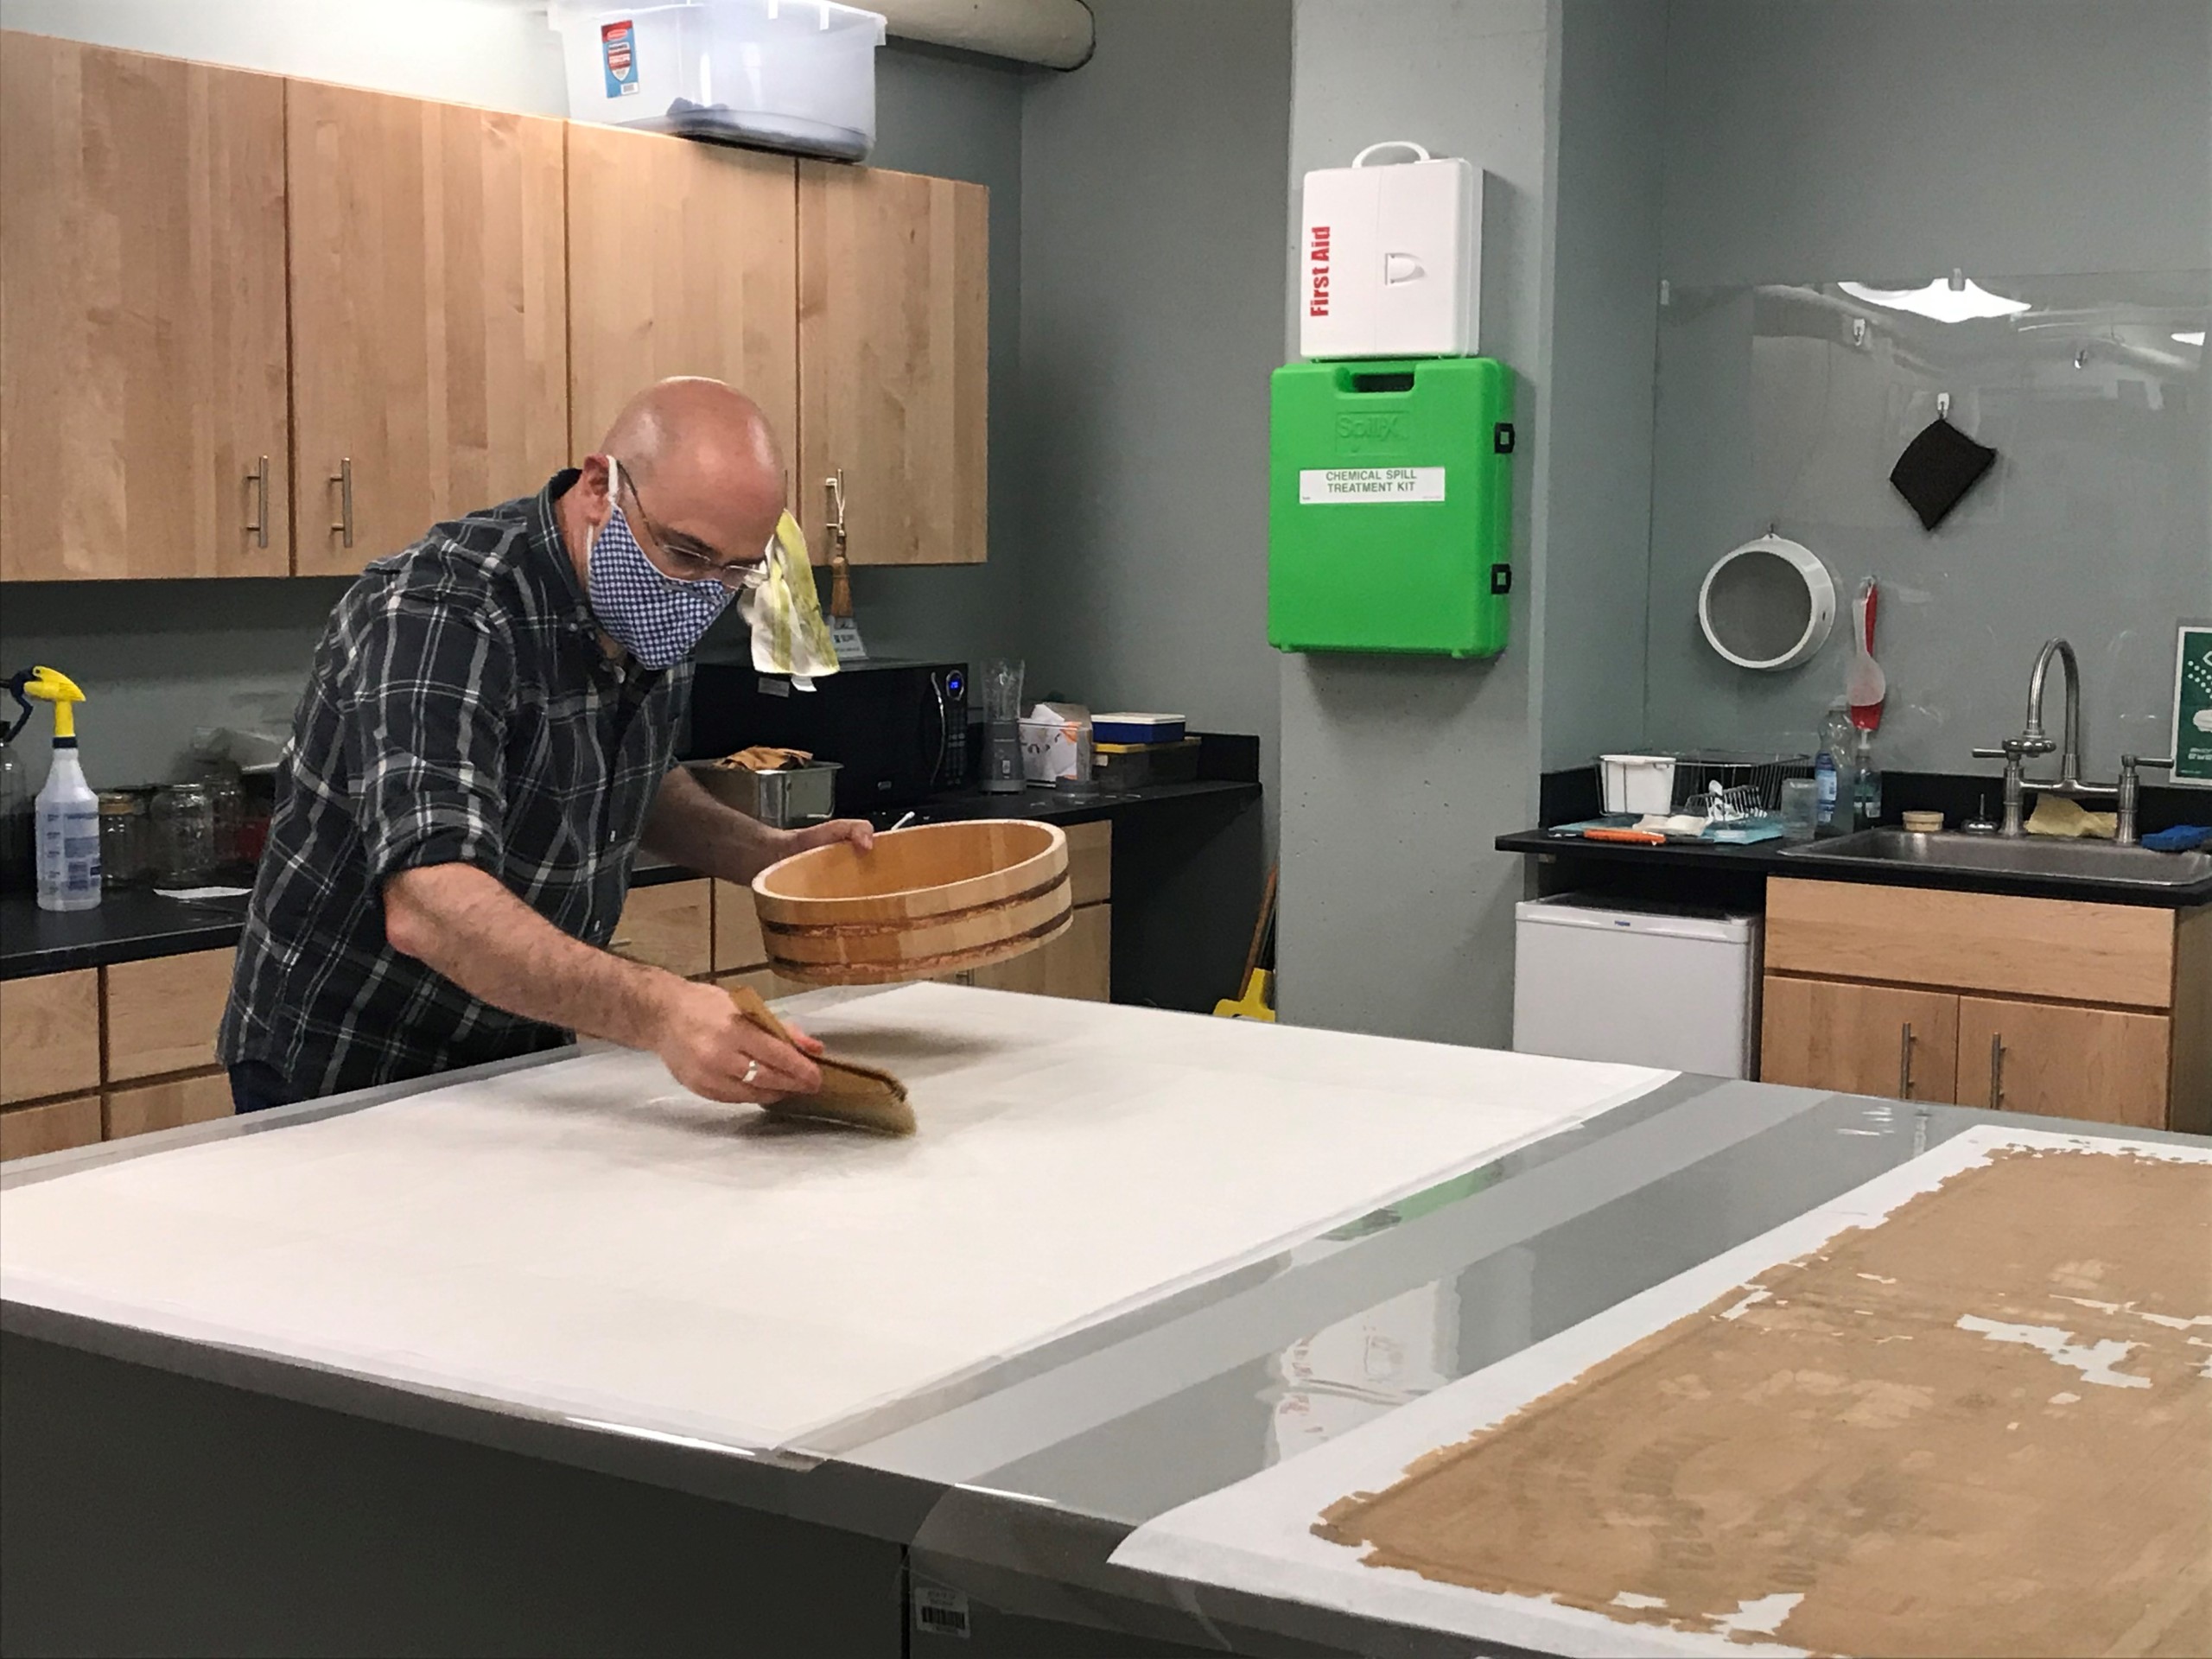
On Nov. 25, 1792, Alexander Hamilton, then first Secretary of the U.S. Treasury, wrote a letter to Colonel Israel Ludlow. It mentions an Act of Congress from April 12 of that year. This was An Act for ascertaining the bounds of a tract of land purchased by John Cleves Symmes. It discussed the boundaries of the tract of land totaling one million acres now called the Miami Purchase. Hamilton’s letter, owned by the Indiana Historical Society, made the request for Ludlow to survey the land and detailed his compensation.
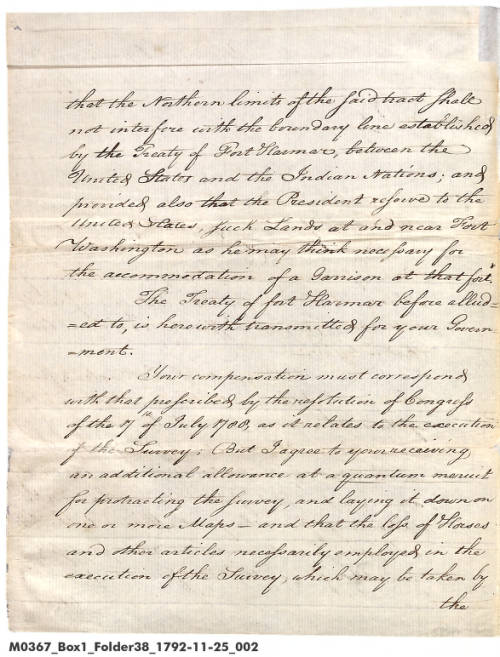
Letter, Alexander Hamilton, Treasury Department, to Israel Ludlow. Nov. 25, 1792. Indiana Historical Society.
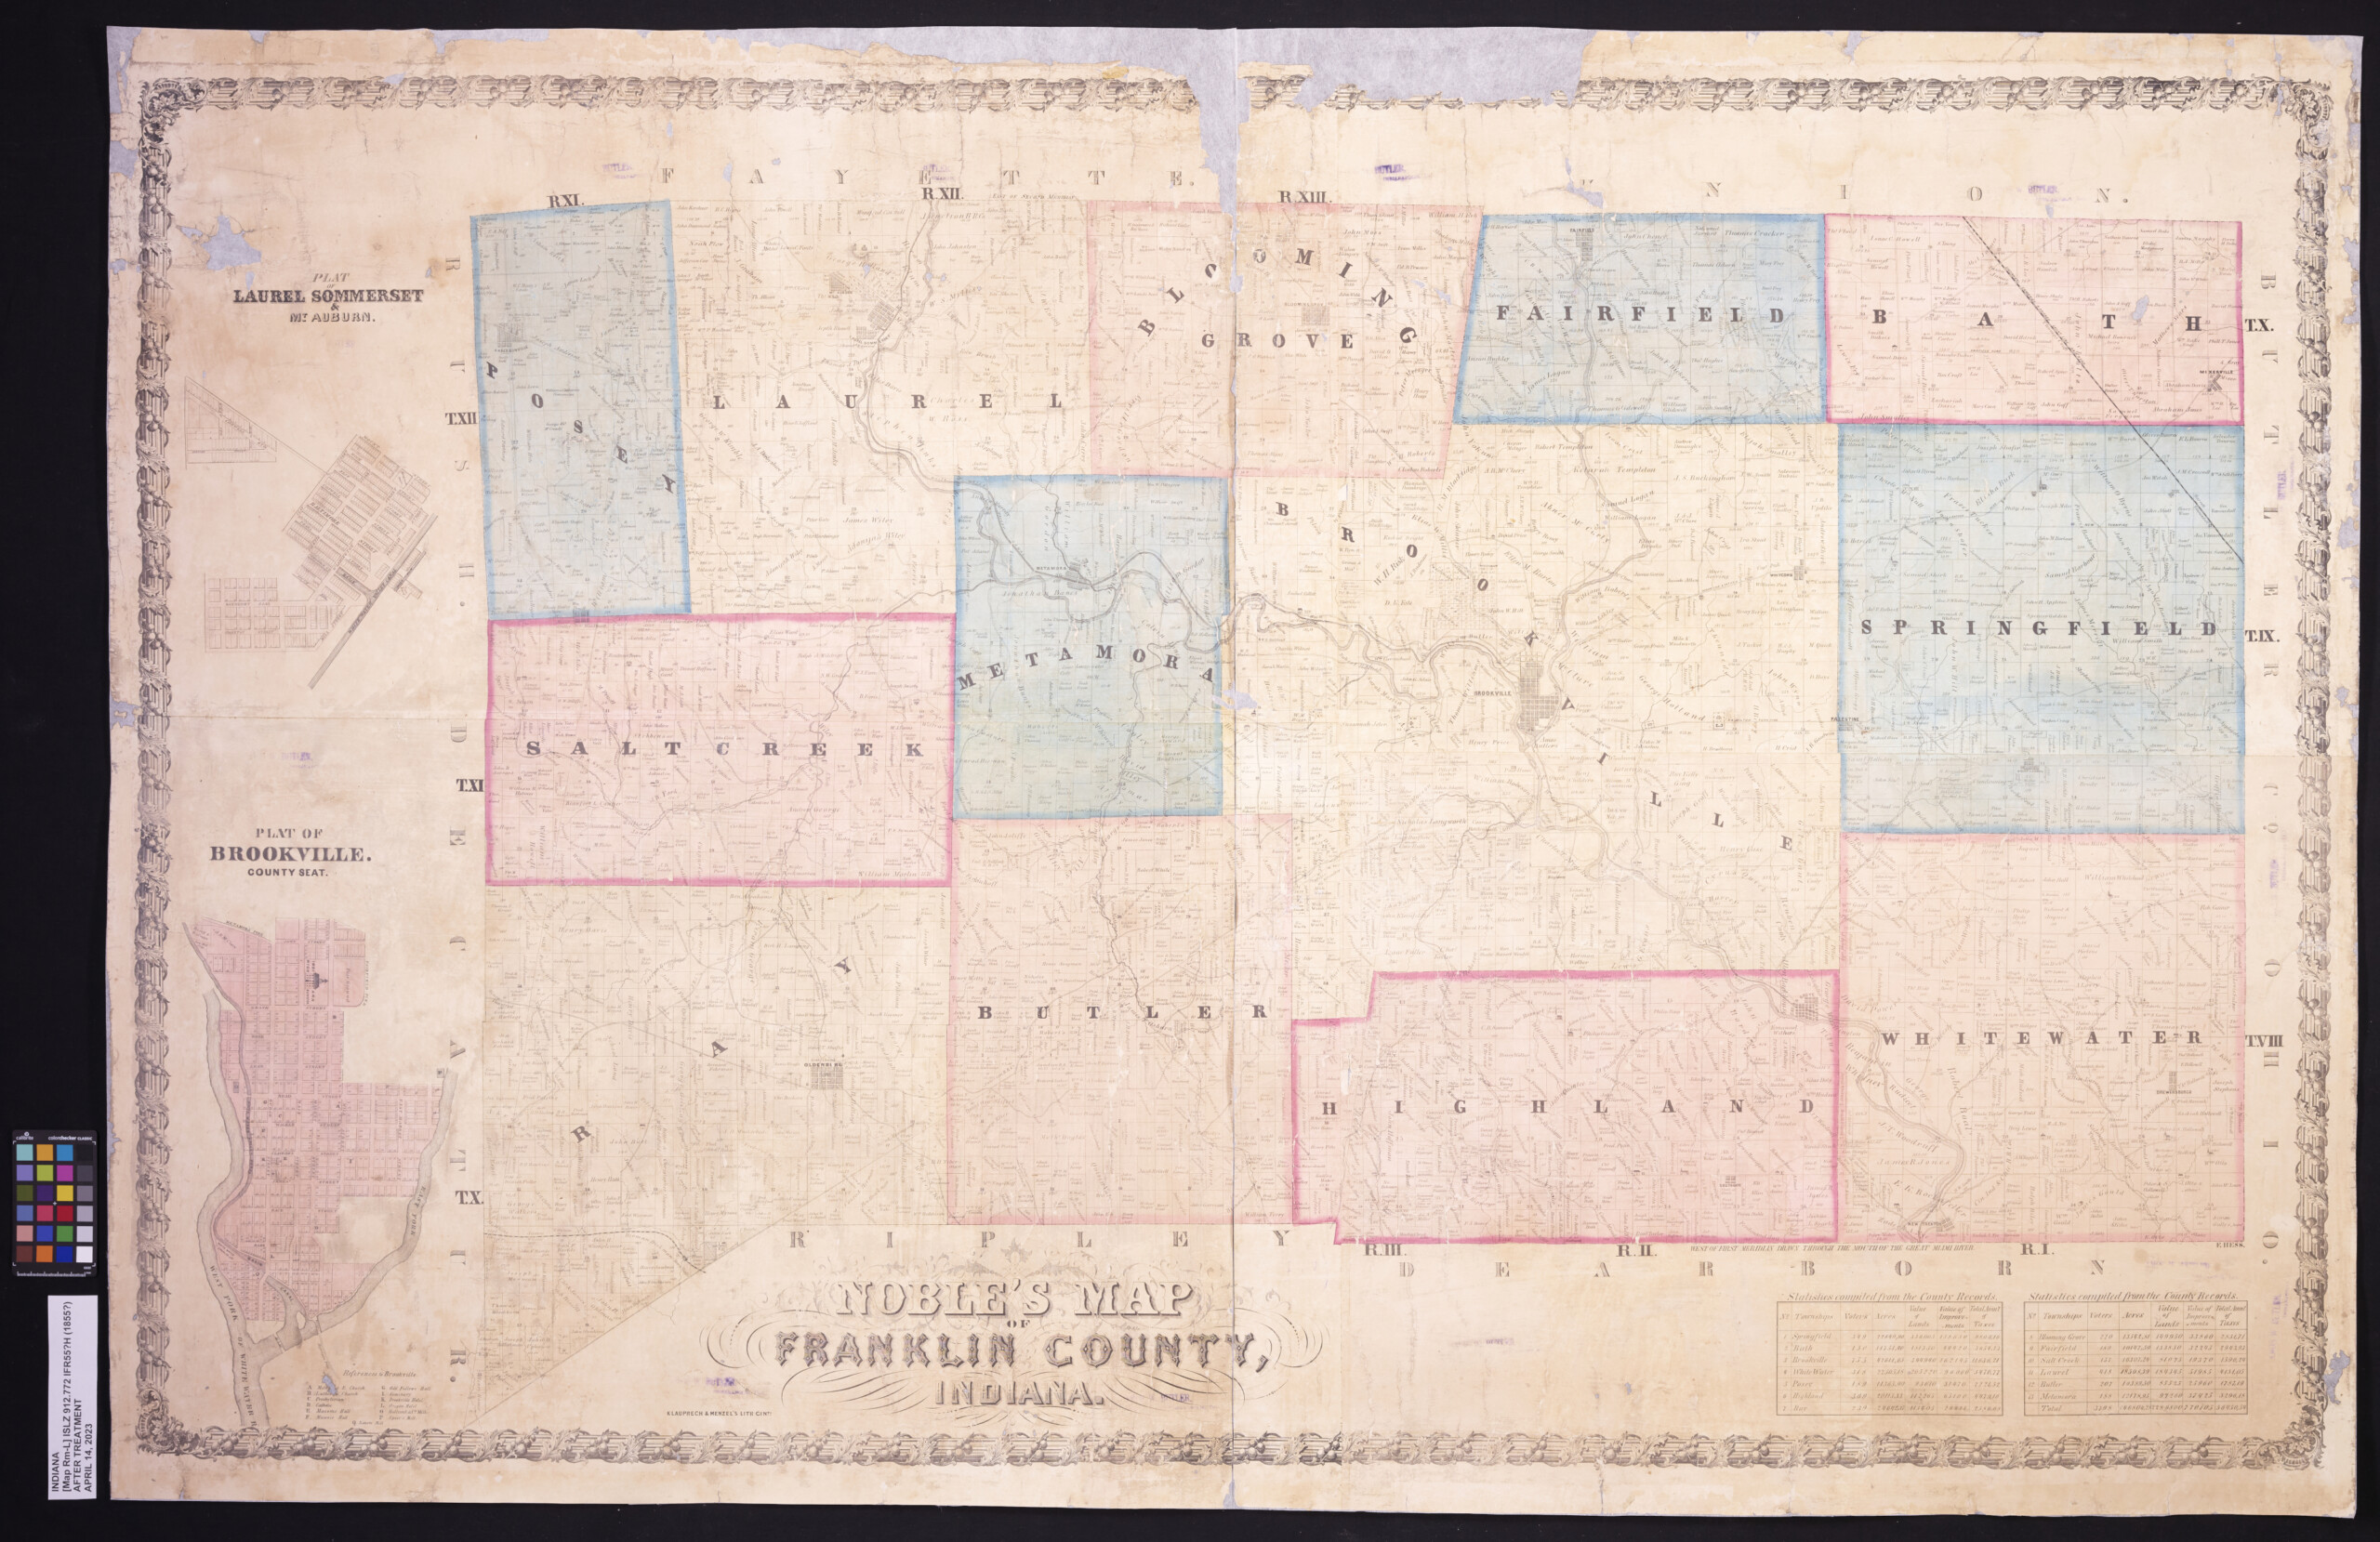
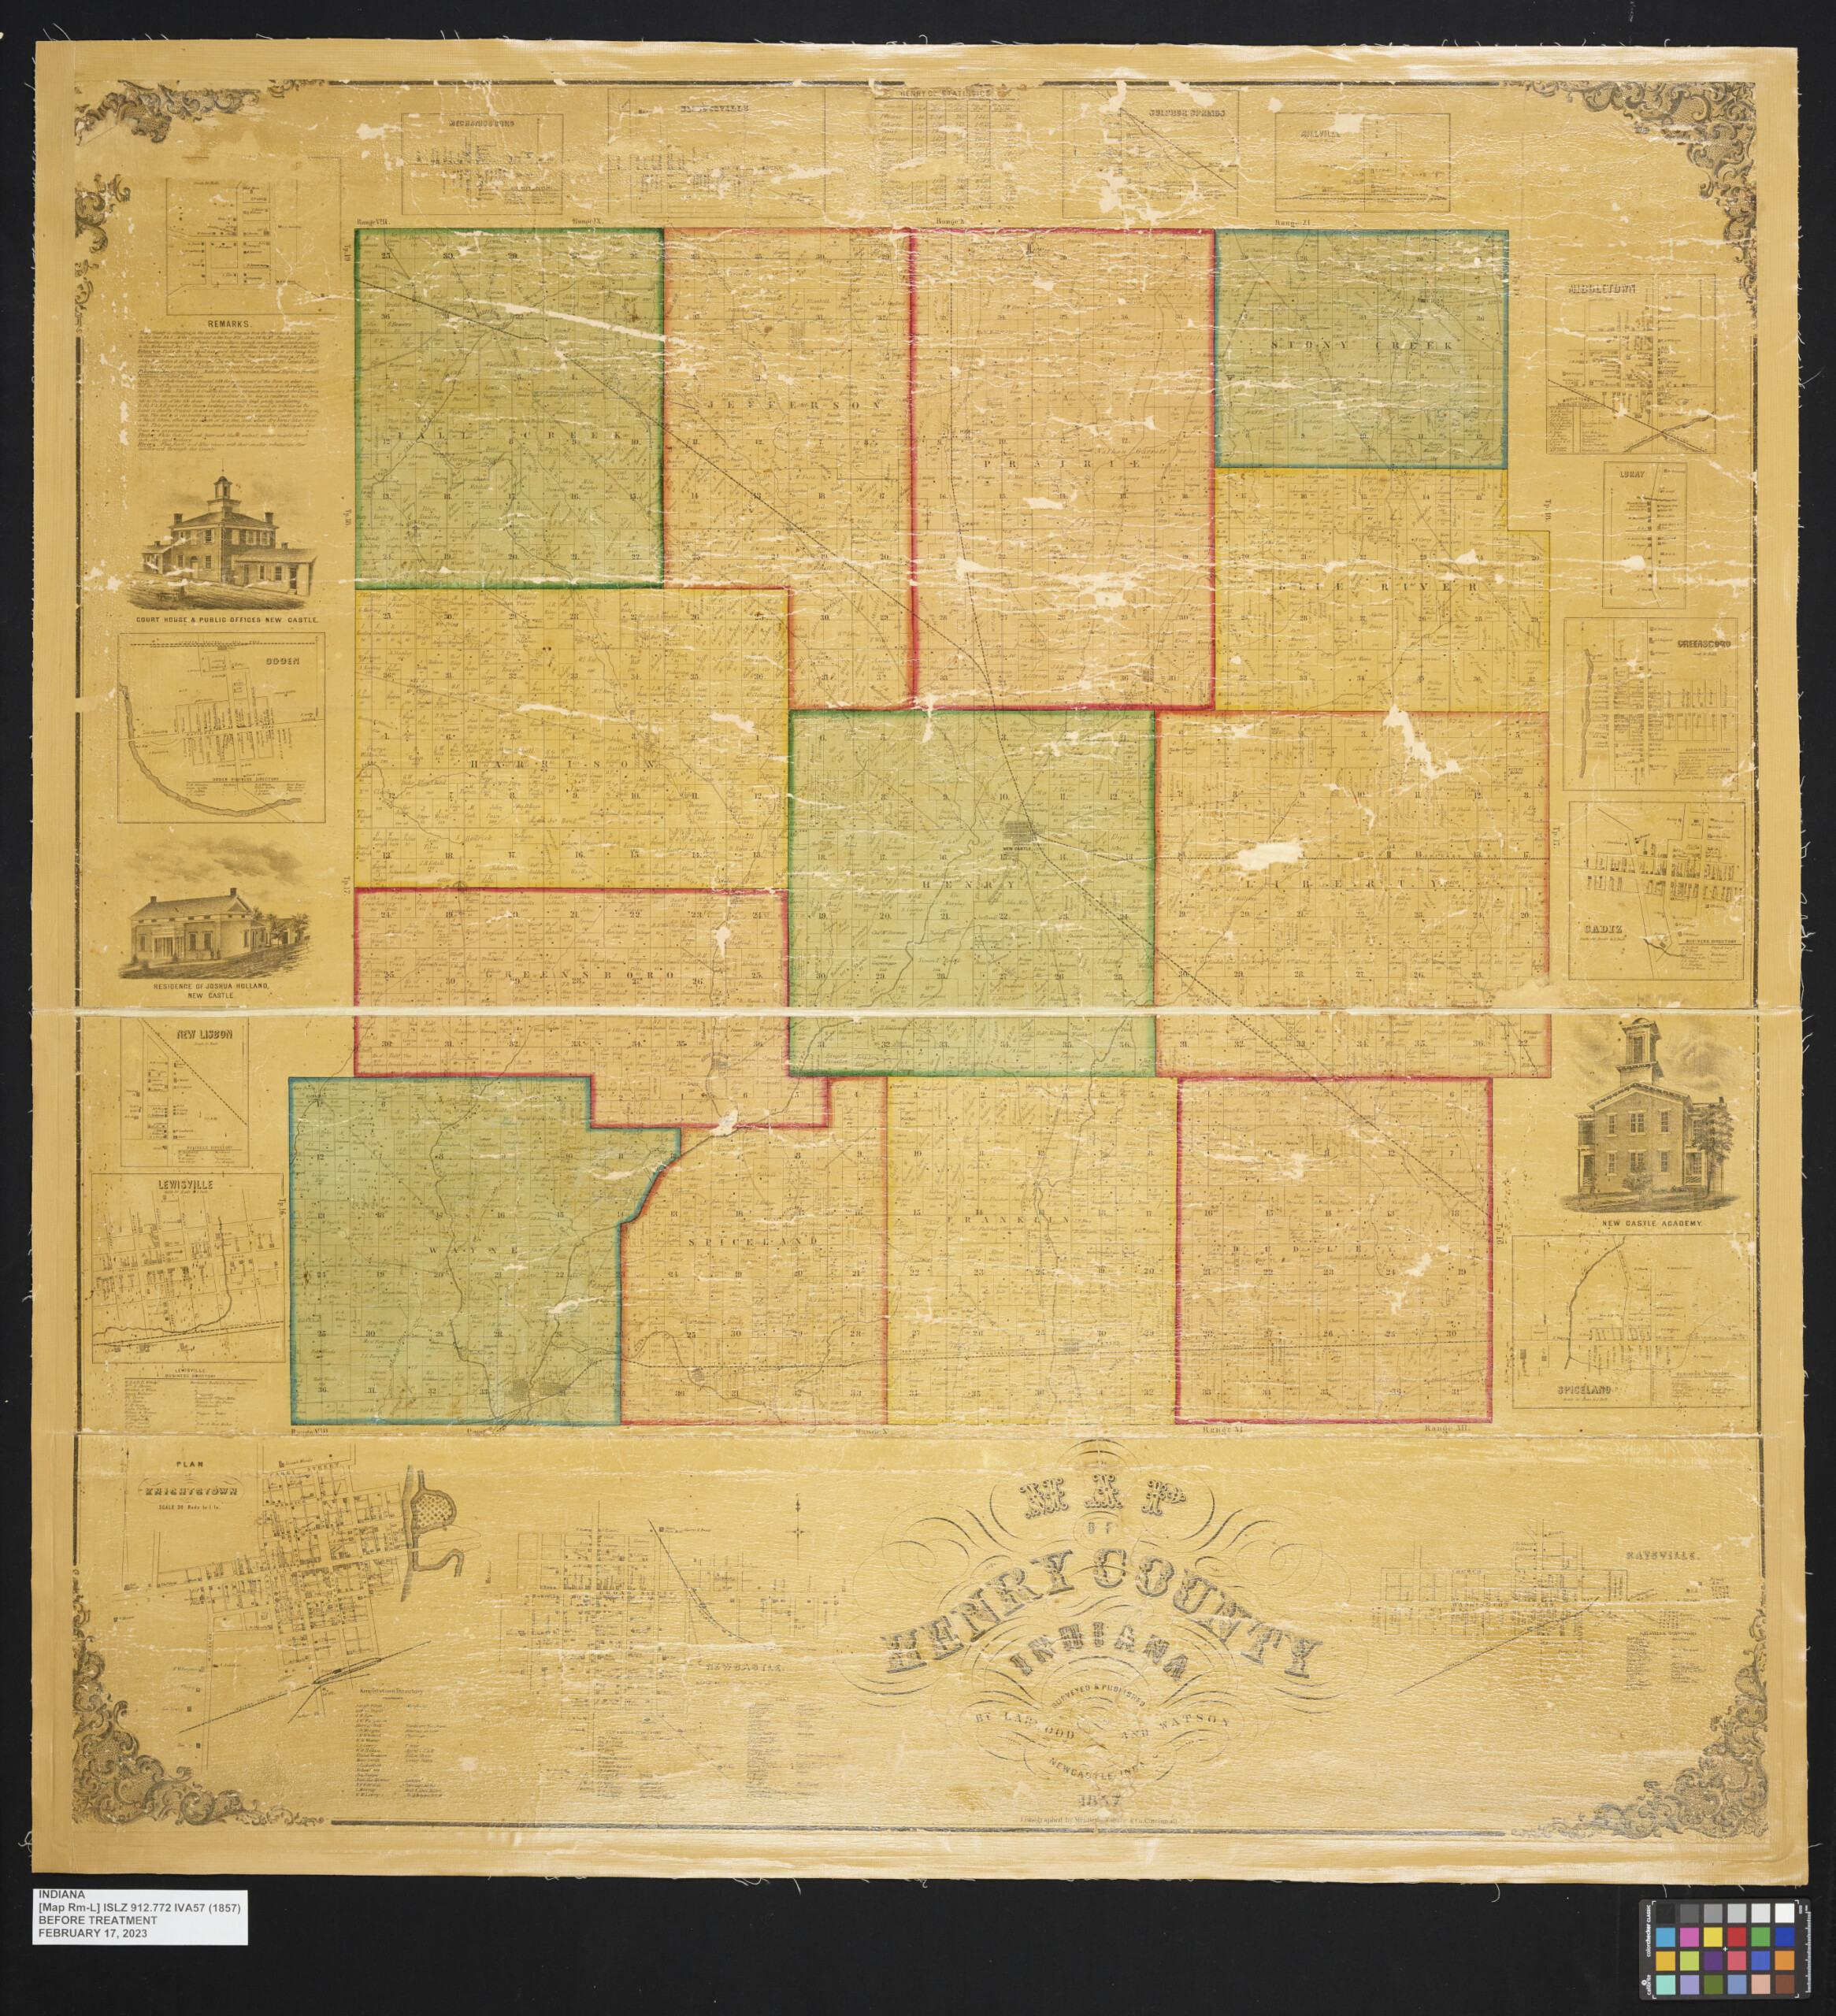
Revolutionary War Brigadier General “Mad” Anthony Wayne, namesake of Wayne County, Indiana was a victor at the Battle of Fallen Timbers in what is now Toledo, Ohio. There, his U.S. Army troops and Kentucky militia defeated members of Miami, Shawnee and Lenape tribal forces along with Canadian troops. This lead to the signing of the Treaty of Greenville in 1795 by Wayne and 13 Native American tribes where the tribes ceded most of Ohio and sections of Illinois, Indiana, Michigan and Wisconsin. The treaty created a triangle-shaped area of land that became “The Gore of Indiana,” meaning triangular piece, as described in Purdue University’s Indiana Land Surveys: Their Development and Uses. It was the first place in Indiana to use townships, sections and quarter-sections. What was referred to as “the gore” is now the counties of Dearborn, Franklin, Ohio, Switzerland, Union and Wayne.
Following the enactment of the U.S. Land Ordinance of May 18, 1796, which created the first permanent office of the U.S. Surveyor General, Indiana’s Greenville Treaty Line was surveyed by Ludlow from 1797 to 1799. This established the first treaty line in U.S. history to separate white settlements from Native American living and hunting areas. A marker from the Indiana Historical Bureau once stood on the old Indiana part of the boundary line. Following the Greenville Treaty, Ludlow surveyed the First Principal Meridian.
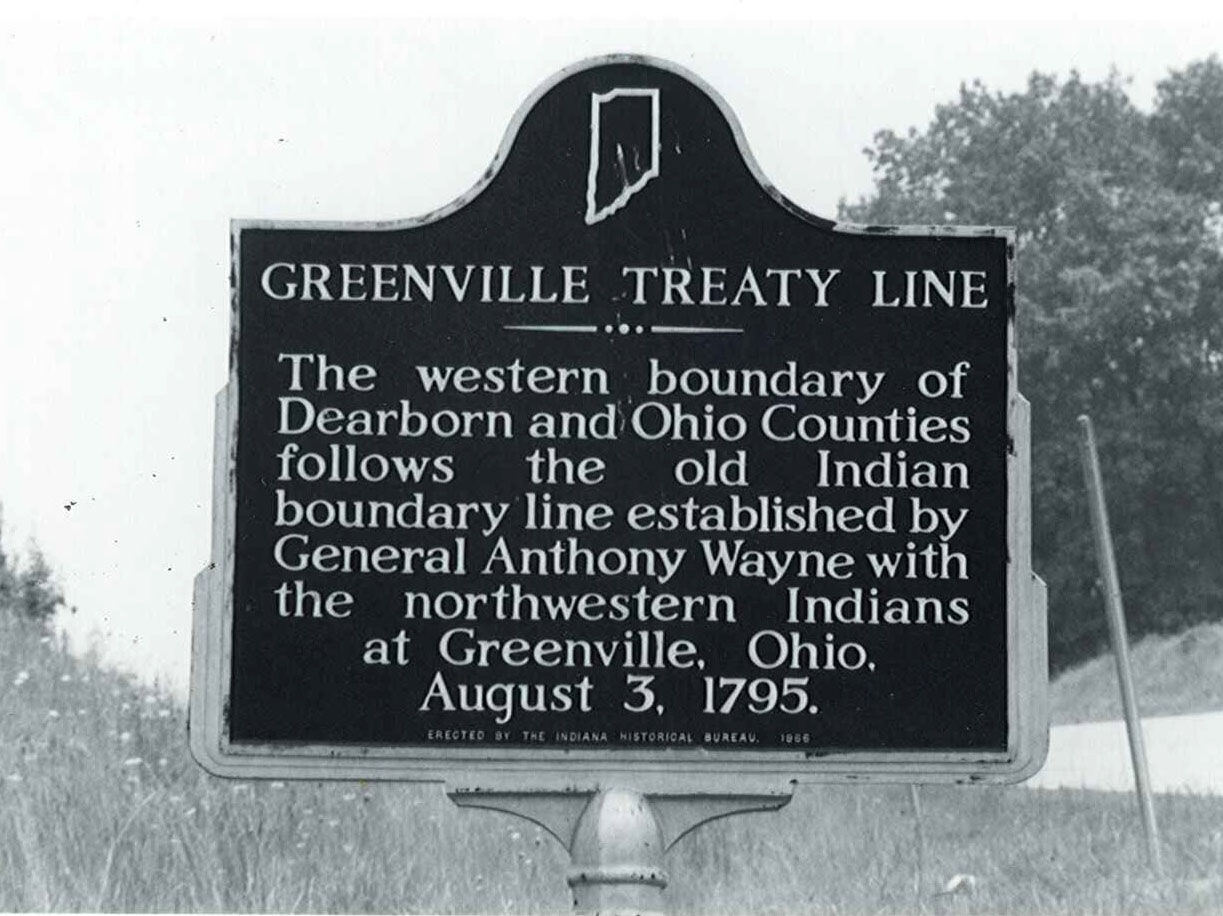
Erected by the Indiana Historical Bureau, 1966. No longer standing.
In the same year as the Louisianna Purchase – on April 30, 1803 – surveying of Indiana was continued by a different team of surveyors and headed by Colonel Jared Mansfield, Surveyor General of the Northwest Territory as appointed by President Thomas Jefferson.
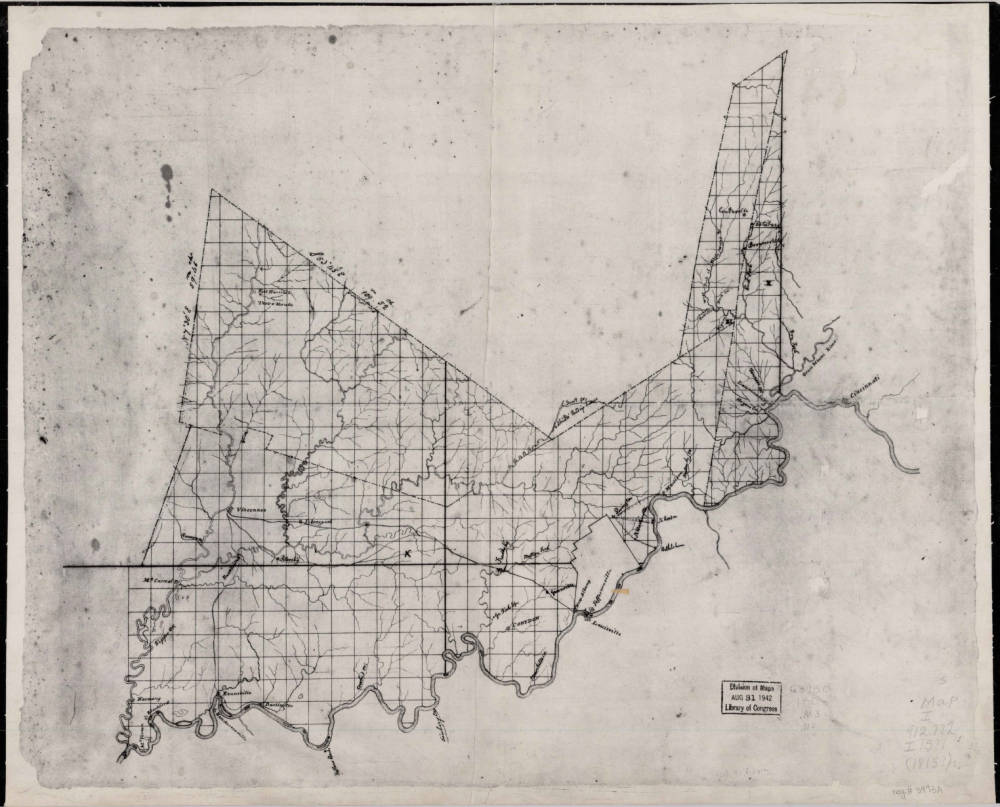
Freeman surveyed the Vincennes Tract, a 1,600,000 acre area in the summer and fall of 1802 and established a boundary for the portion of land below the Vincennes Tract known as the Freeman Line. Native Americans sold this portion at the Treaty of Vincennes in 1804. (See the March 1916 Indiana Magazine of History article, The First Public Land Surveys in Indiana; Freeman’s Lines.)
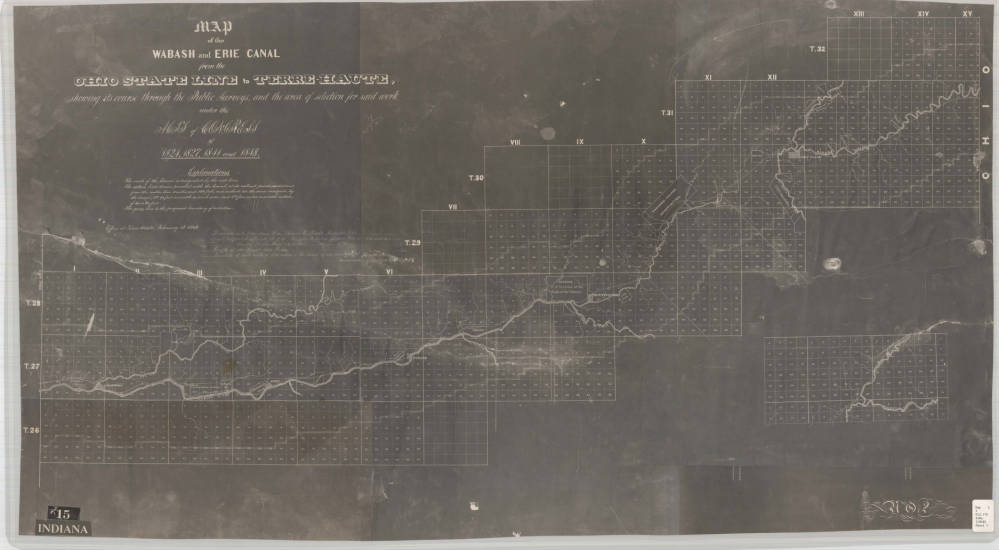
G.C. Steinhardt and D. P. Franzmeier state in their paper Indiana Land Surveys, Their Development and Uses, “The state survey was completed about 1834. In the process, the surveyors took notes that vividly described the physiography and vegetation, location of settlements and Indian villages and problems encountered.”
These field notes have now been made available to the public with a project that has lasted more than a decade. The Historical Indiana PLSS Township Records project allows the public to view surveyors’ technical descriptions of the land from the years surrounding Indiana becoming a state.
The Indiana PLSS Notes and Plats are available on the Internet Archive. The entire team responsible for the work of the project is listed here.
The State Library and the Indiana Geographic Information Council sponsored a webinar in 2021 featuring Lorraine Wright, a Licensed Geologist and GIS Professional, which gives details about the ongoing project.
Clayton Hogston, a professional land surveyor based in Indianapolis, provides the Indiana Transcribed PLSS Records from federal, state, and county surveyors to the public for free. He distributes these records using a thumb drive. Request a copy by sending an email or contacting the Indiana State Data Center.
Explore the project on the new IndianaMap website.
This blog post was written by Katie Springer, reference librarian. For more information, contact the Reference and Government Services Division at 317-232-3678 or submit an Ask-A-Librarian request.