
Maps are an incredibly useful tool for genealogy and local history researchers. They can show insights into how people lived that are not readily apparent through other documentary sources. They can be used to help untangle research questions and show off your research in new ways. Maps are also fun to use in research; they are often colorful and provide a level of visual interest not often found in written documents.
Maps show how people lived in and experienced their world
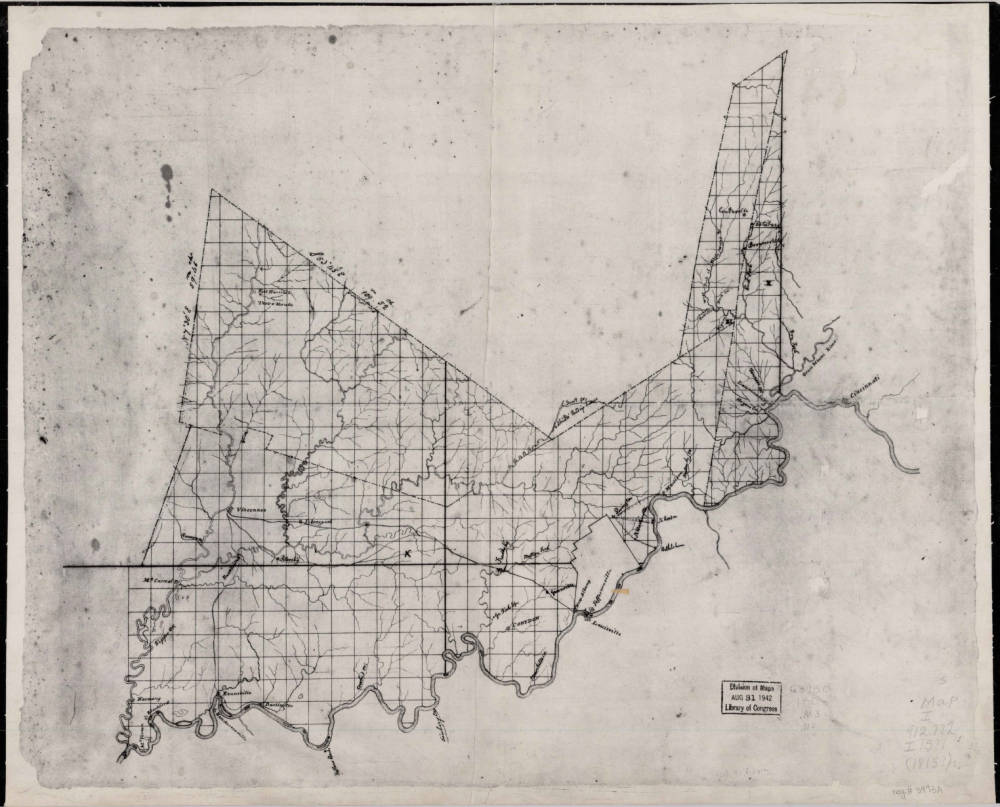
Southern Indiana as surveyed in 1815. Image from the Indiana State Library Digital Collections.
Maps are a useful snapshot of how a place was at a specific point in time. Looking at modern maps can be useful in your research, but an old map can show you how an area appeared at the time your ancestor lived there. Whether you are looking at a river that has changed its course or the expansion of a city over time, contemporaneous maps illustrated the environment that people of the past would have seen on a daily basis and also give you insight into how they lived. For example, you can see the distance people traveled to reach stores, entertainment venues and places of worship or see how close they lived to their friends and neighbors.
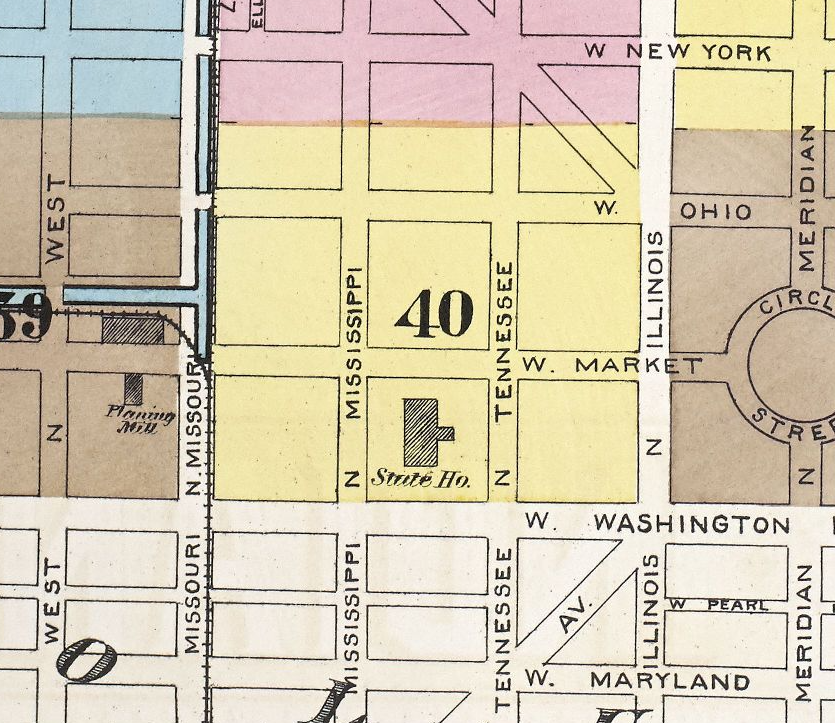
This 1887 fire insurance map shows the Indiana State Capitol Building bounded on the east and west by Tennessee and Mississippi Streets. These streets are now called Capitol Avenue and Senate Avenue.
If your ancestors were rural dwellers, you might be interested in rural route maps. Although these often do not name the residents of each house, you may be able to identify the households using census records. Soil survey maps are also of interest, as they show the soil type and quality for an area and may provide insight into the types of crops that were grown in a region.
Weather maps are also interesting to researchers. You can use them to look at weather patterns for a region or to find the weather forecast for your ancestors’ birthdays, weddings or other major life events. From the early 20th century on, weather maps were often published in newspapers on a daily or weekly basis. You can also use newspapers to find articles on significant weather events, such as tornadoes, hurricanes or blizzards.
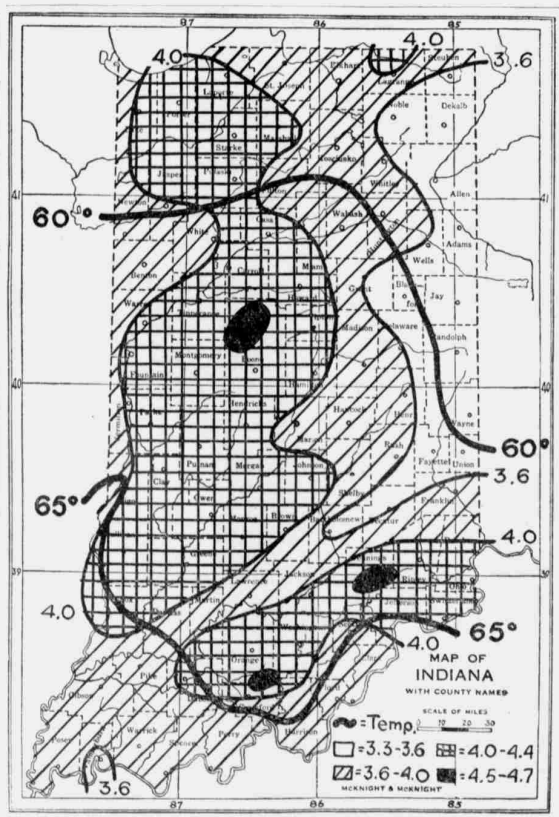
Average temperature and rainfall for May; Indianapolis Star, May 3, 1936, page 34.
Topographical maps primarily show geographic, rather than man-made, features. They were invented to depict three-dimensional features such as mountains, hills and valleys in a two-dimensional medium. For family history researchers, these maps show how geography may have influenced settlement patterns and how people interacted with one another. For example, families who lived just a few miles from one another may not have socialized much if they were separated by steep hills or a large river.
Topographical maps are available digitally from the United States Geological Survey. They include the most recent maps, as well as historic maps.
Boundary changes, or how to move while standing still
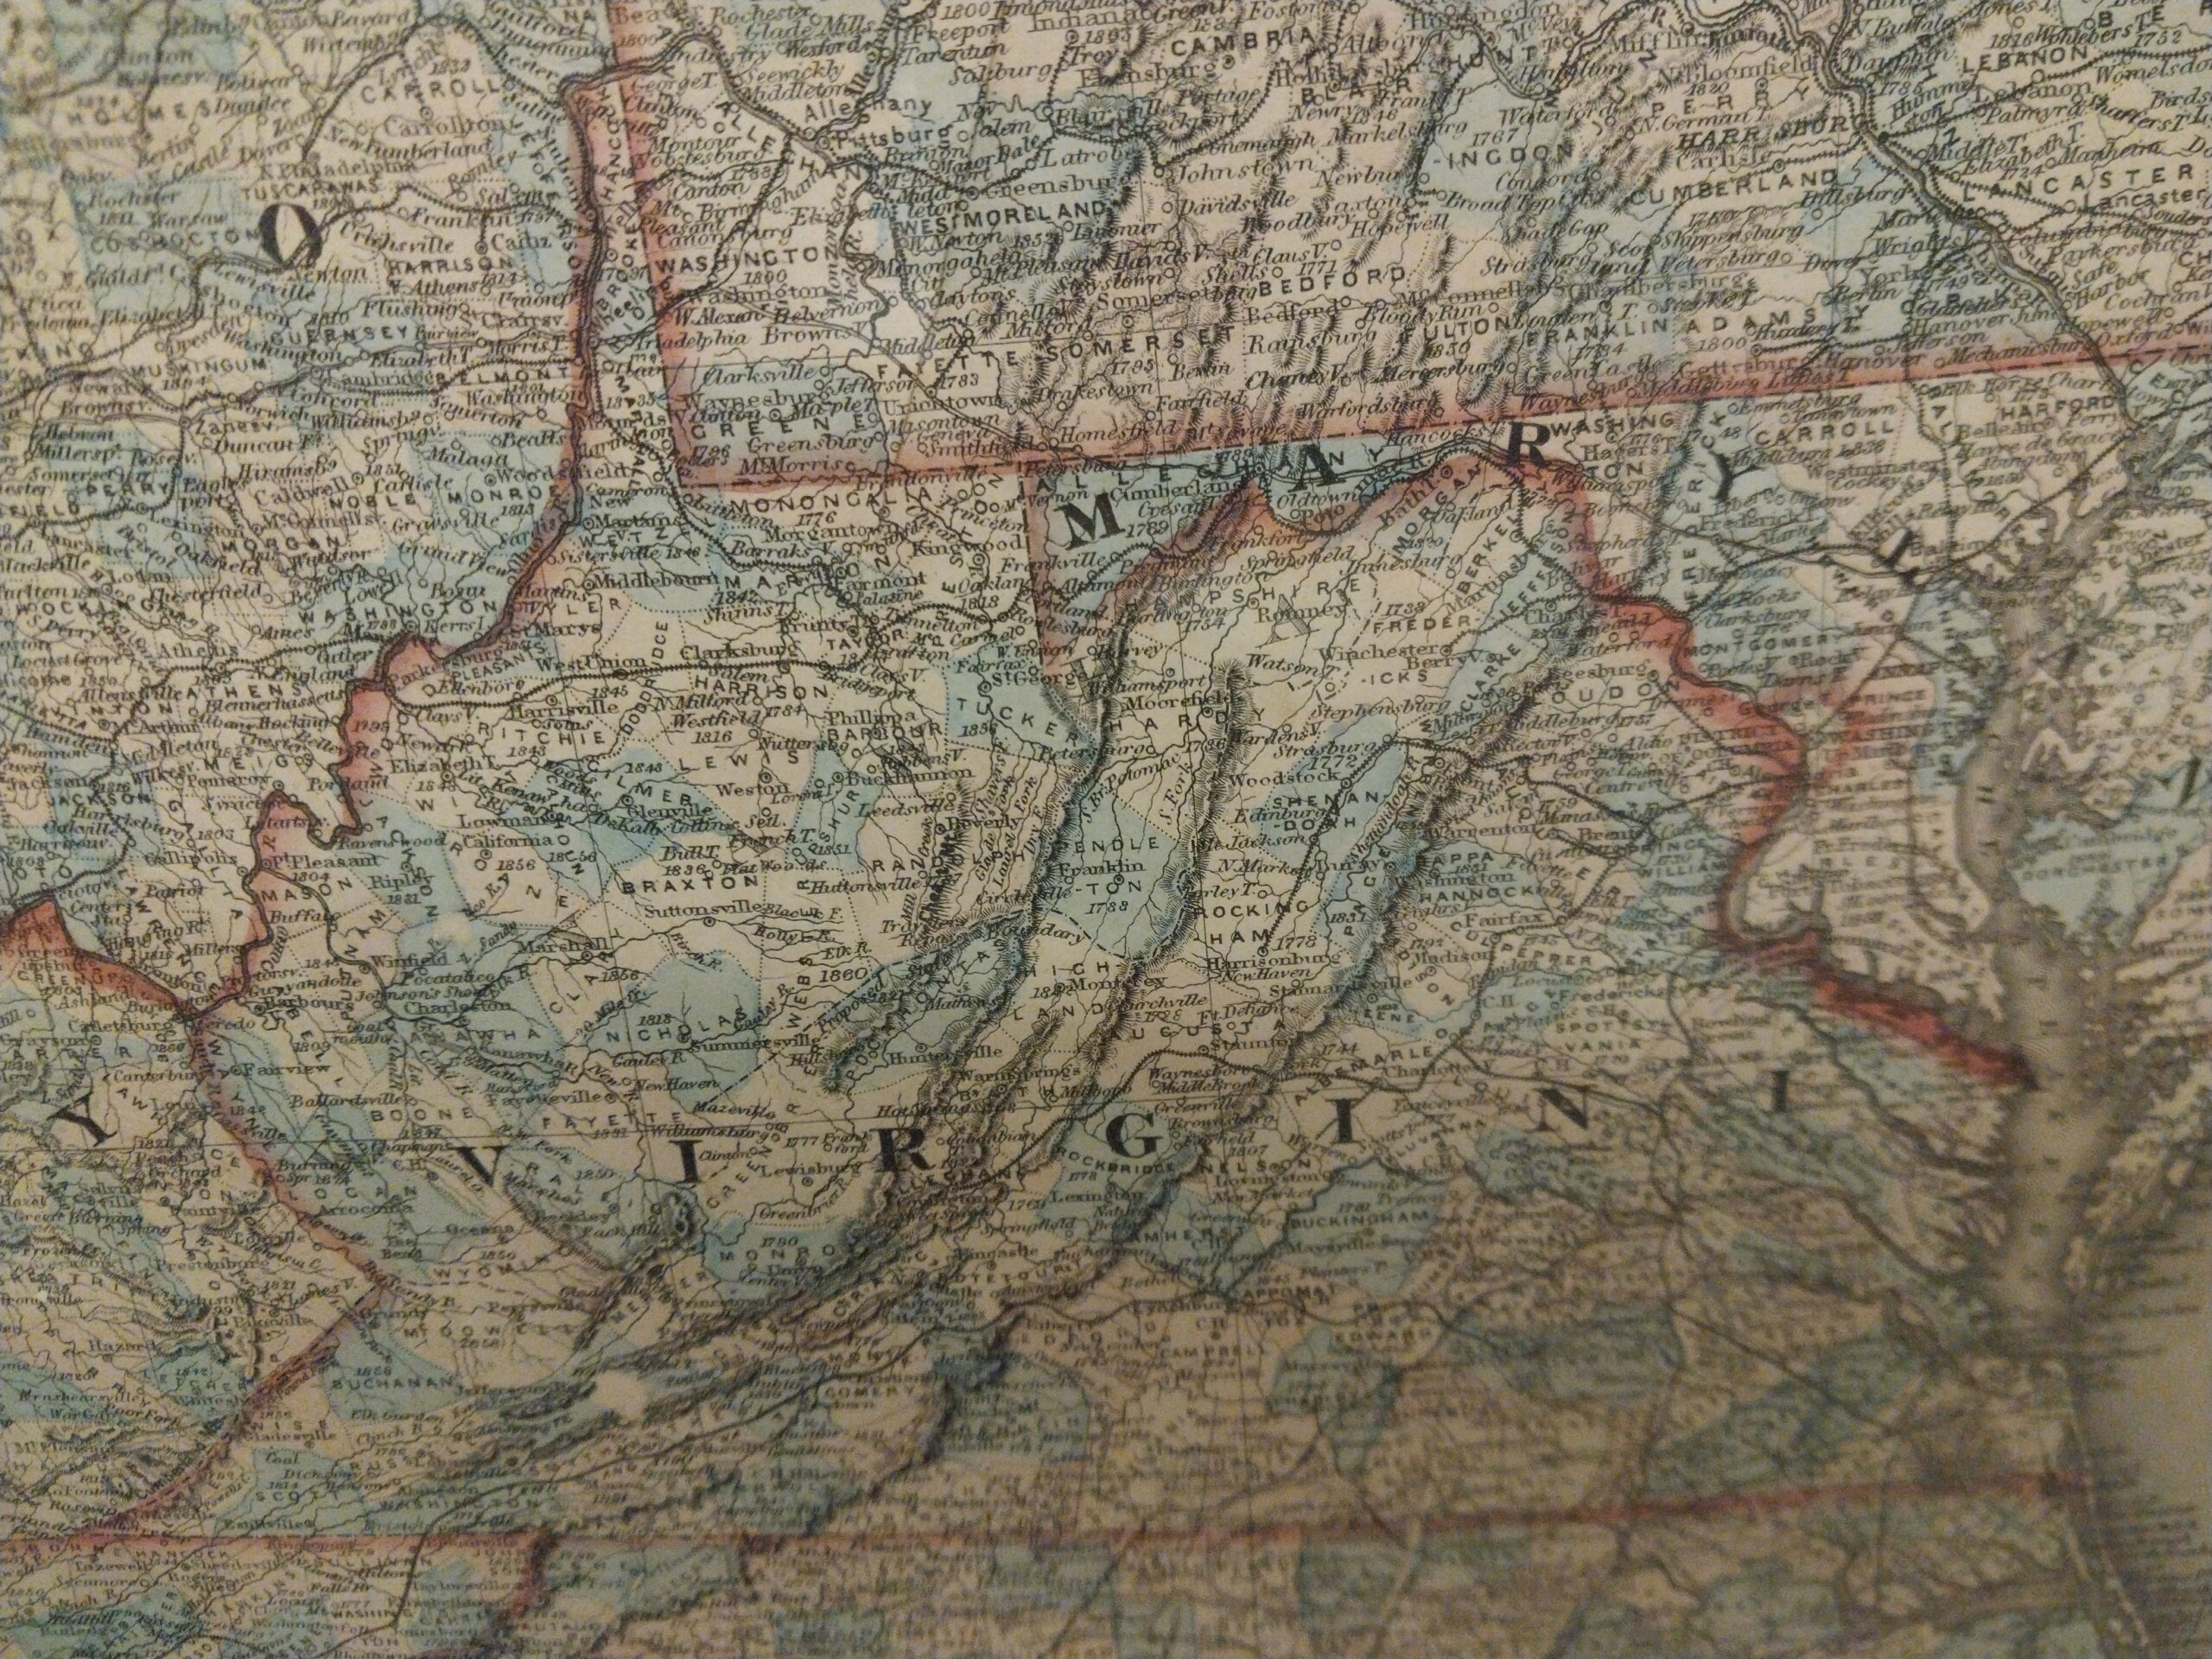
Virginia as it appeared prior to the creation of West Virginia. Map published by S. Taintor & Co., Rochester, NY and Philadelphia, PA, 1862.
On June 19, 1863, the people of Charleston went to bed in Virginia. The next morning, they awoke in West Virginia. Were they sleepwalking? Abducted by aliens? No, on June 20, 1863, West Virginia became a state and thousands of people were suddenly living in a new place without even moving.
Most boundary changes are not quite so dramatic and involved either the establishment of a new county or the redrawing of county or township lines as population levels grew over time. One of the best resources for tracing boundary changes in the United States is the Atlas of Historical County Boundaries hosted by the Newberry Library.
Make your own maps!
There are many mapping apps and software available online, in both free and paid versions. You can use these to make your own maps that document information relevant to your ancestors. That may include mapping migration routes, cemeteries, land ownership or other geographic information.
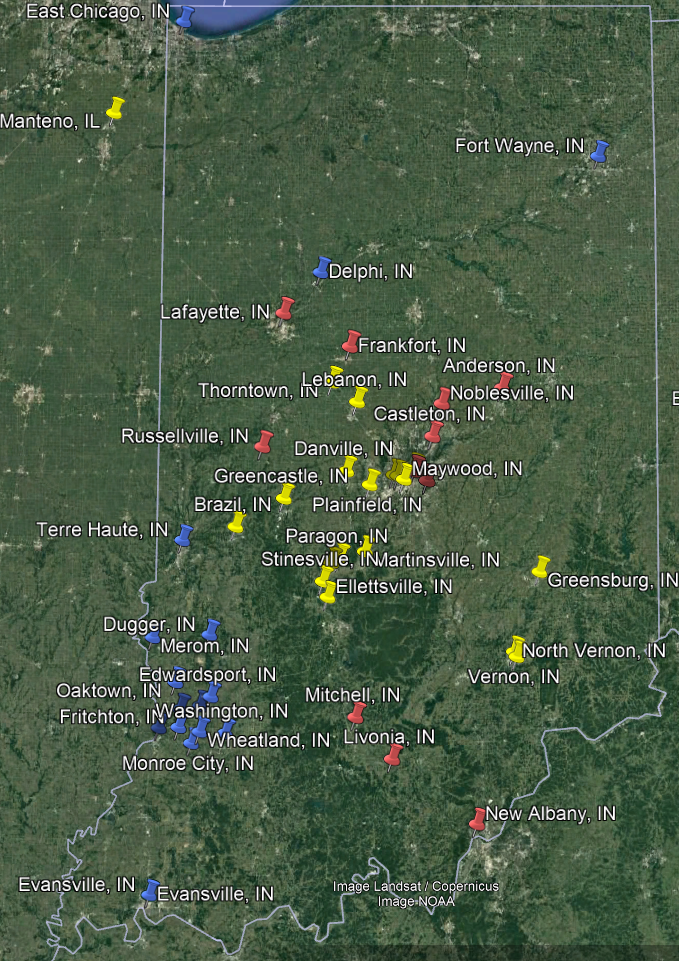
For example, the map above shows Indiana cities and towns that a family lived in between 1800 and 2000. The different colored pins denote different branches of the family. These pins show how the family moved and interacted over the years.
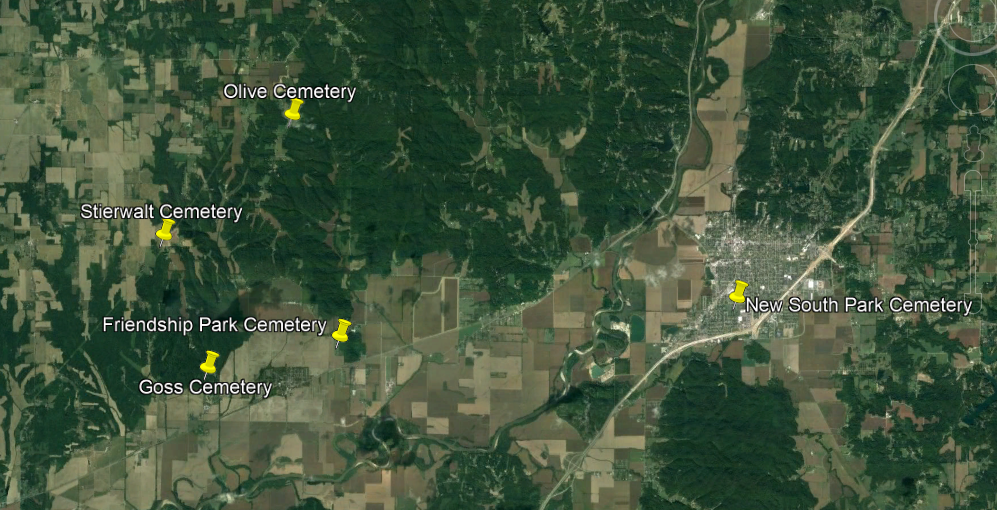
The map above shows select cemeteries between Paragon and Martinsville in Morgan County, Indiana. The family members who are buried in these cemeteries were all rural dwellers and locating their exact residences has proved difficult. However, by mapping the cemeteries used by the family, we are able to narrow down the area where they lived. If you are having trouble locating cemeteries, Find a Grave provides the geocoordinates of almost every cemetery they have indexed, which makes pinpointing the cemeteries a breeze.
Looking for maps? You’re in the right place
Do you need a plat map? Highway map? State park map? The Indiana State Library has digitized a wide variety of Indiana maps, which are available through our Digital Collections and are available to researchers everywhere.
This blog post is by Jamie Dunn, Genealogy Division supervisor.