In December of last year, Kathy Kozenski from the Geography Educators’ Network of Indiana and I brought a giant 15′ x 21′ Indiana floor map to the Vigo County Public Library for a program called “Get On The Map!” Library patrons, ages 3 to 15, joined us in learning about state geography as we walked in socked feet across cities, lakes, rivers and forests.

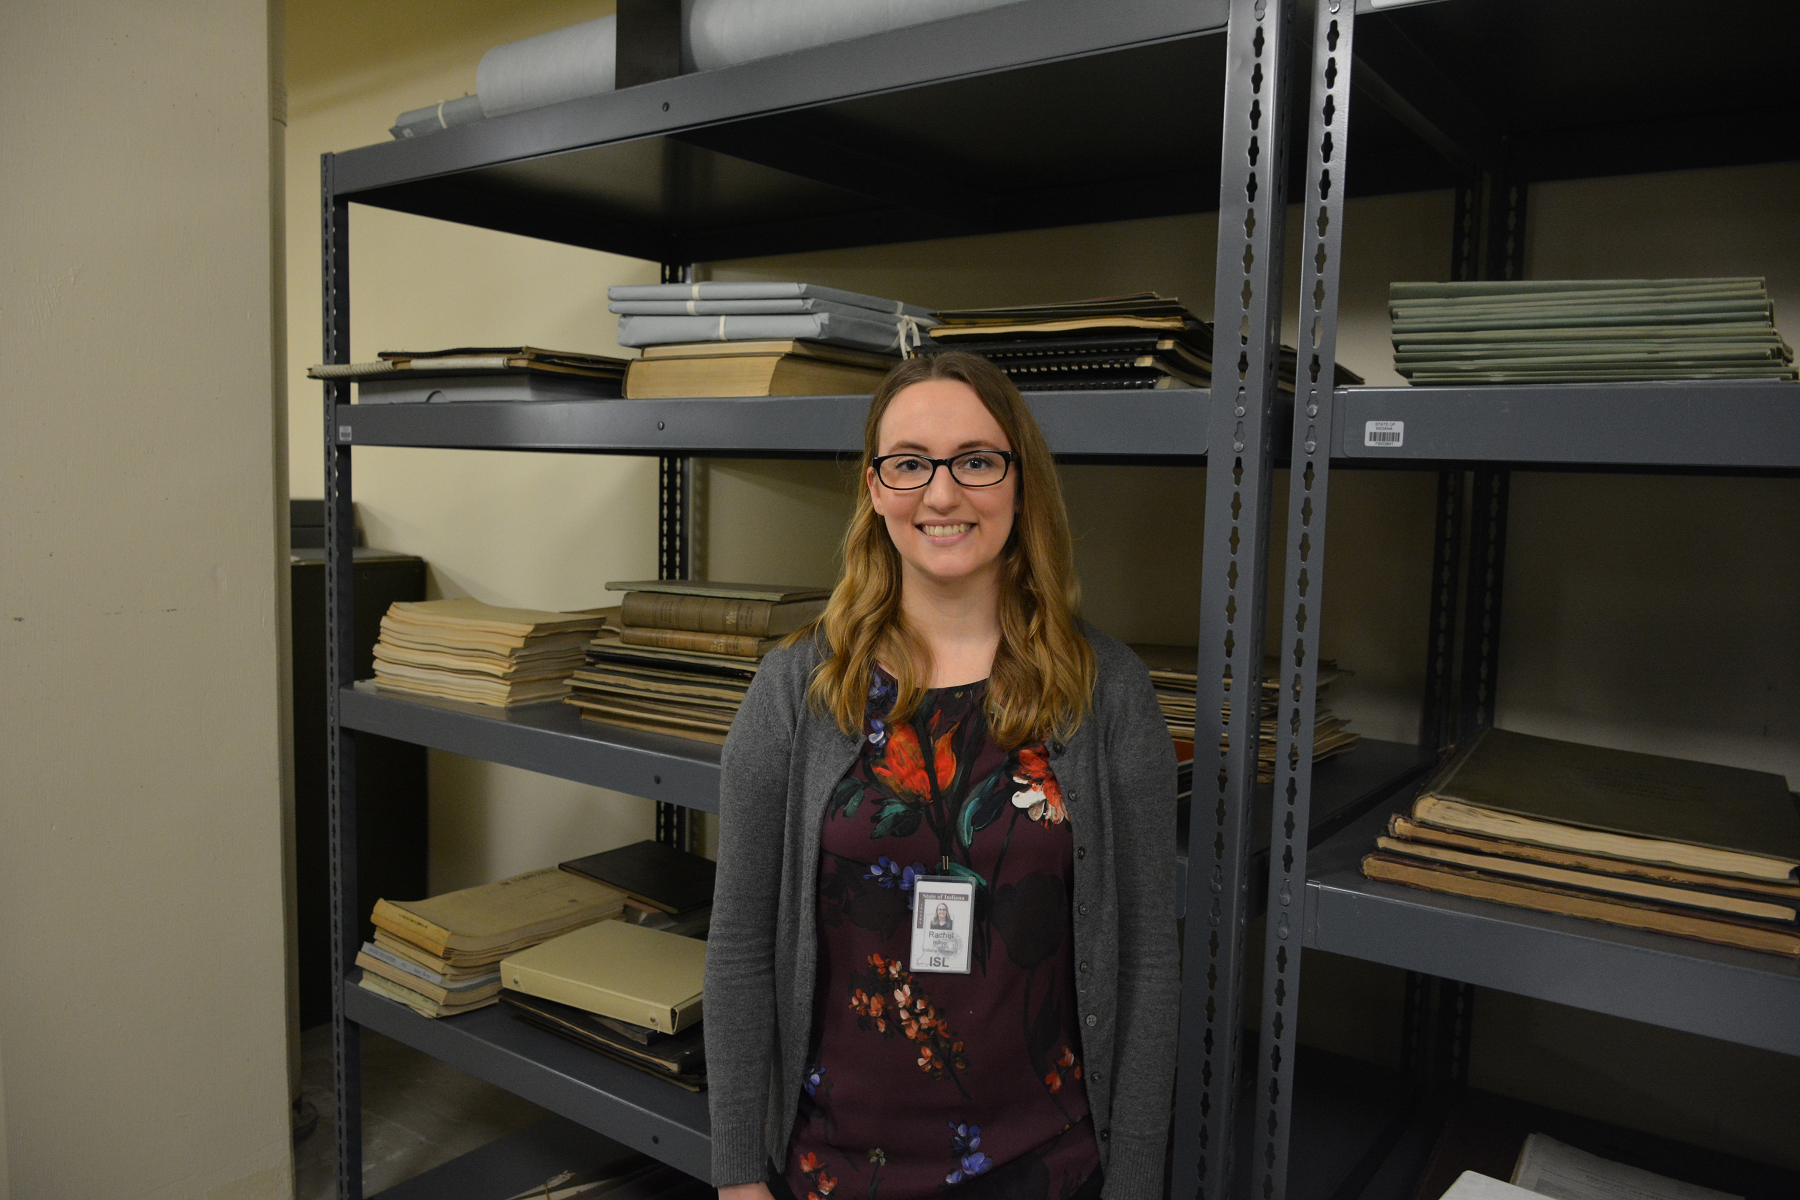
Photo courtesy of Lauri Chandler, Youth Services Manager at the Vigo County Public Library.
We discussed the cardinal directions and talked with the students about where they had lived and traveled, and where they would like to go in the future. Despite their young ages, many had already been outside of the state and even outside of the country. We asked students to identify and locate map features. Lake Michigan, one of the map’s prominent features, was a favorite.
We asked what we might find in Indiana cities or towns. Answers were:
“Buildings!”
“Roads!”
“Trees!”
“Pets!”
“Cars!”
Part of my reason for this question was to introduce the idea of the census, so we asked what else a city or town needed in order to have all of these things.
“People!,” they answered.
This provided us with a chance to discuss how many people live in different areas, and that when there are more people we need more resources. We talked about the upcoming 2020 census, why we count people and why it is important to get an accurate count so that resources can be distributed where they are needed.
We followed our map exploration with the storied adventures of Fred the Fish. Made of a small piece of muslin, Fred swam in a river – a plastic container of water – next to several different sources of pollution. We poured in small amounts of dirt, oil and trash. We demonstrated the effects of these things on Fred, and talked about how important it is to notice the effects of human population on the surrounding environment.
With the 2020 Census approaching, librarians are on the forefront of community outreach, as our jobs will involve helping patrons report data to the federal government. This will be the first U.S. census in history to provide the opportunity for online response, and we expect to welcome our patrons to answer the census at our public computers.
In October of 2018, the American Library Association issued a policy brief entitled Libraries and the 2020 Census Vital Partners for a Complete Count that explains how libraries act as “trusted partners in achieving a complete count in the 2020 census” by:
- Delivering information about the census and hosting community outreach activities
- Providing internet access to enable respondents to complete the census form online
- Serving as trusted messengers, including in hard-to-count communities
- Training data users and providing access to census statistics for businesses and community members.
ALA recently hosted a free webinar, “Libraries and the 2020 Census” through its Chapter Advocacy Exchange. You can view the webinar here. The ALA president, assistant director of government relations and deputy director of public policy addressed the important role libraries play in ensuring a complete and accurate count of people. It featured librarians planning 2020 census outreach in Montana, California and Illinois.
In Indiana, there are several ways we can participate in planning for the 2020 census, which will take place a year from now, in March and April of 2020. Local communities are building Complete Count Committees, also known as CCCs, to encourage participation. At your library, you can help by hosting outreach efforts from the Census Bureau, promoting census jobs as they are available and incorporating census information in newsletters, social media and websites. Last week, the Census Bureau released its 2020 promotional guidelines. You can retrieve the PDF here.
For more information about the 2020 census in Indiana and how you can help, visit the Census in Indiana website. Follow the State Data Center on Facebook and Twitter for census messages and contact us at the Indiana State Library with questions.
GENI loans out giant traveling floor maps of Indiana to libraries and schools along with curriculum guides and a trunk full of learning tools.
This blog post by Katie Springer, reference librarian. For more information, contact the Reference & Government Services Division at 317-232-3678 or submit an Ask-A-Librarian request.


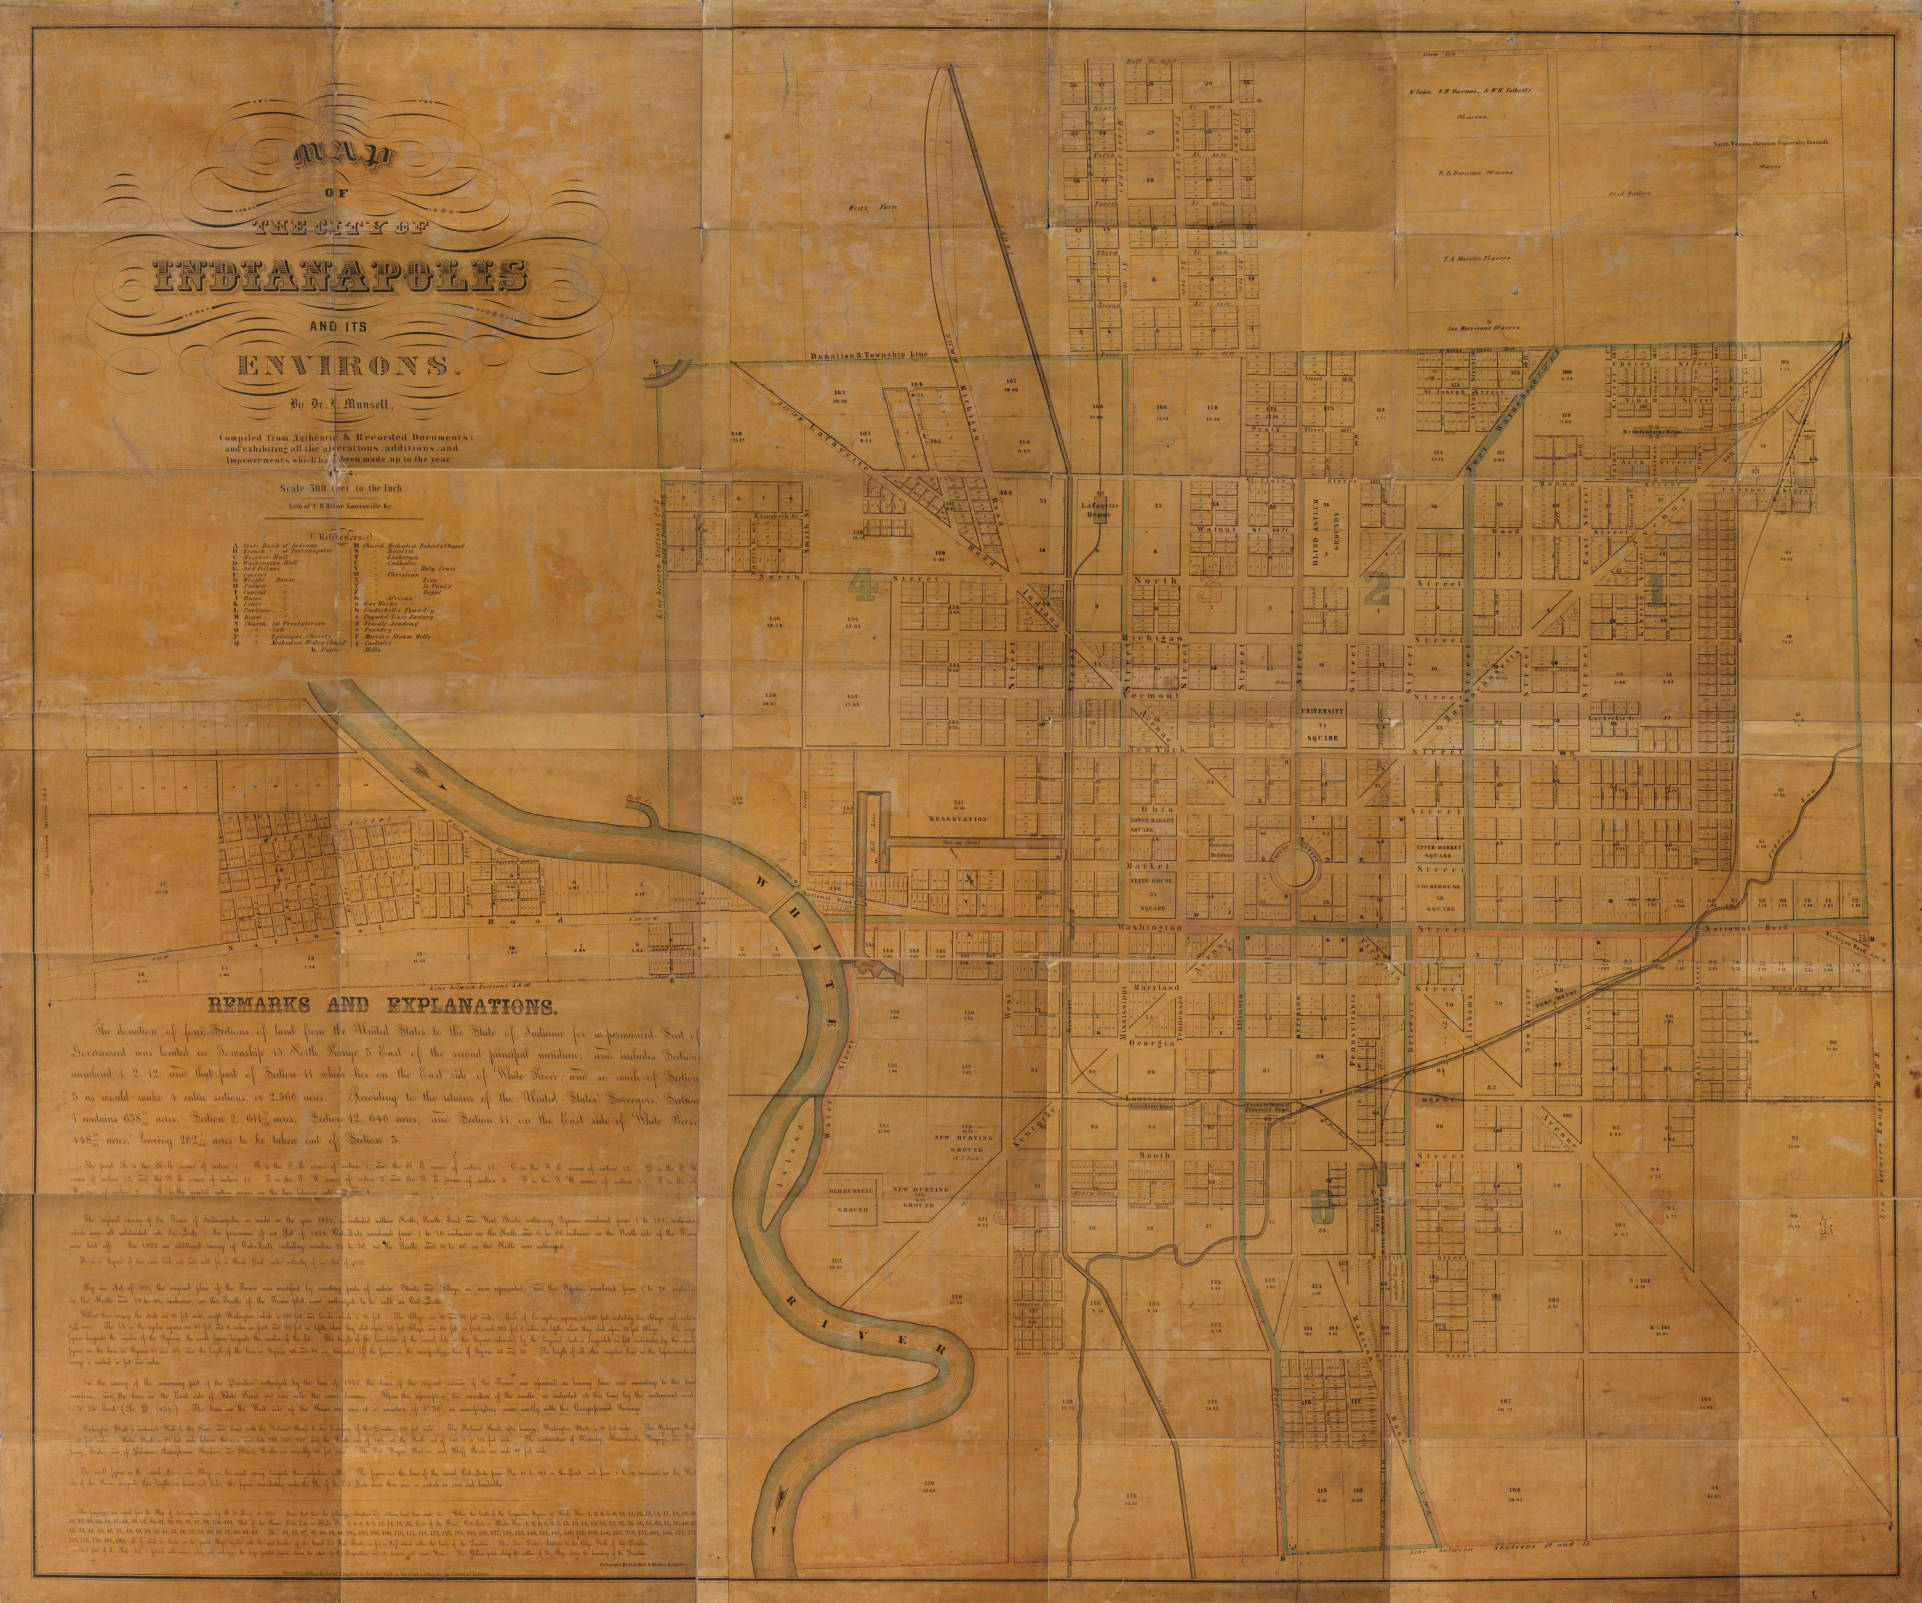
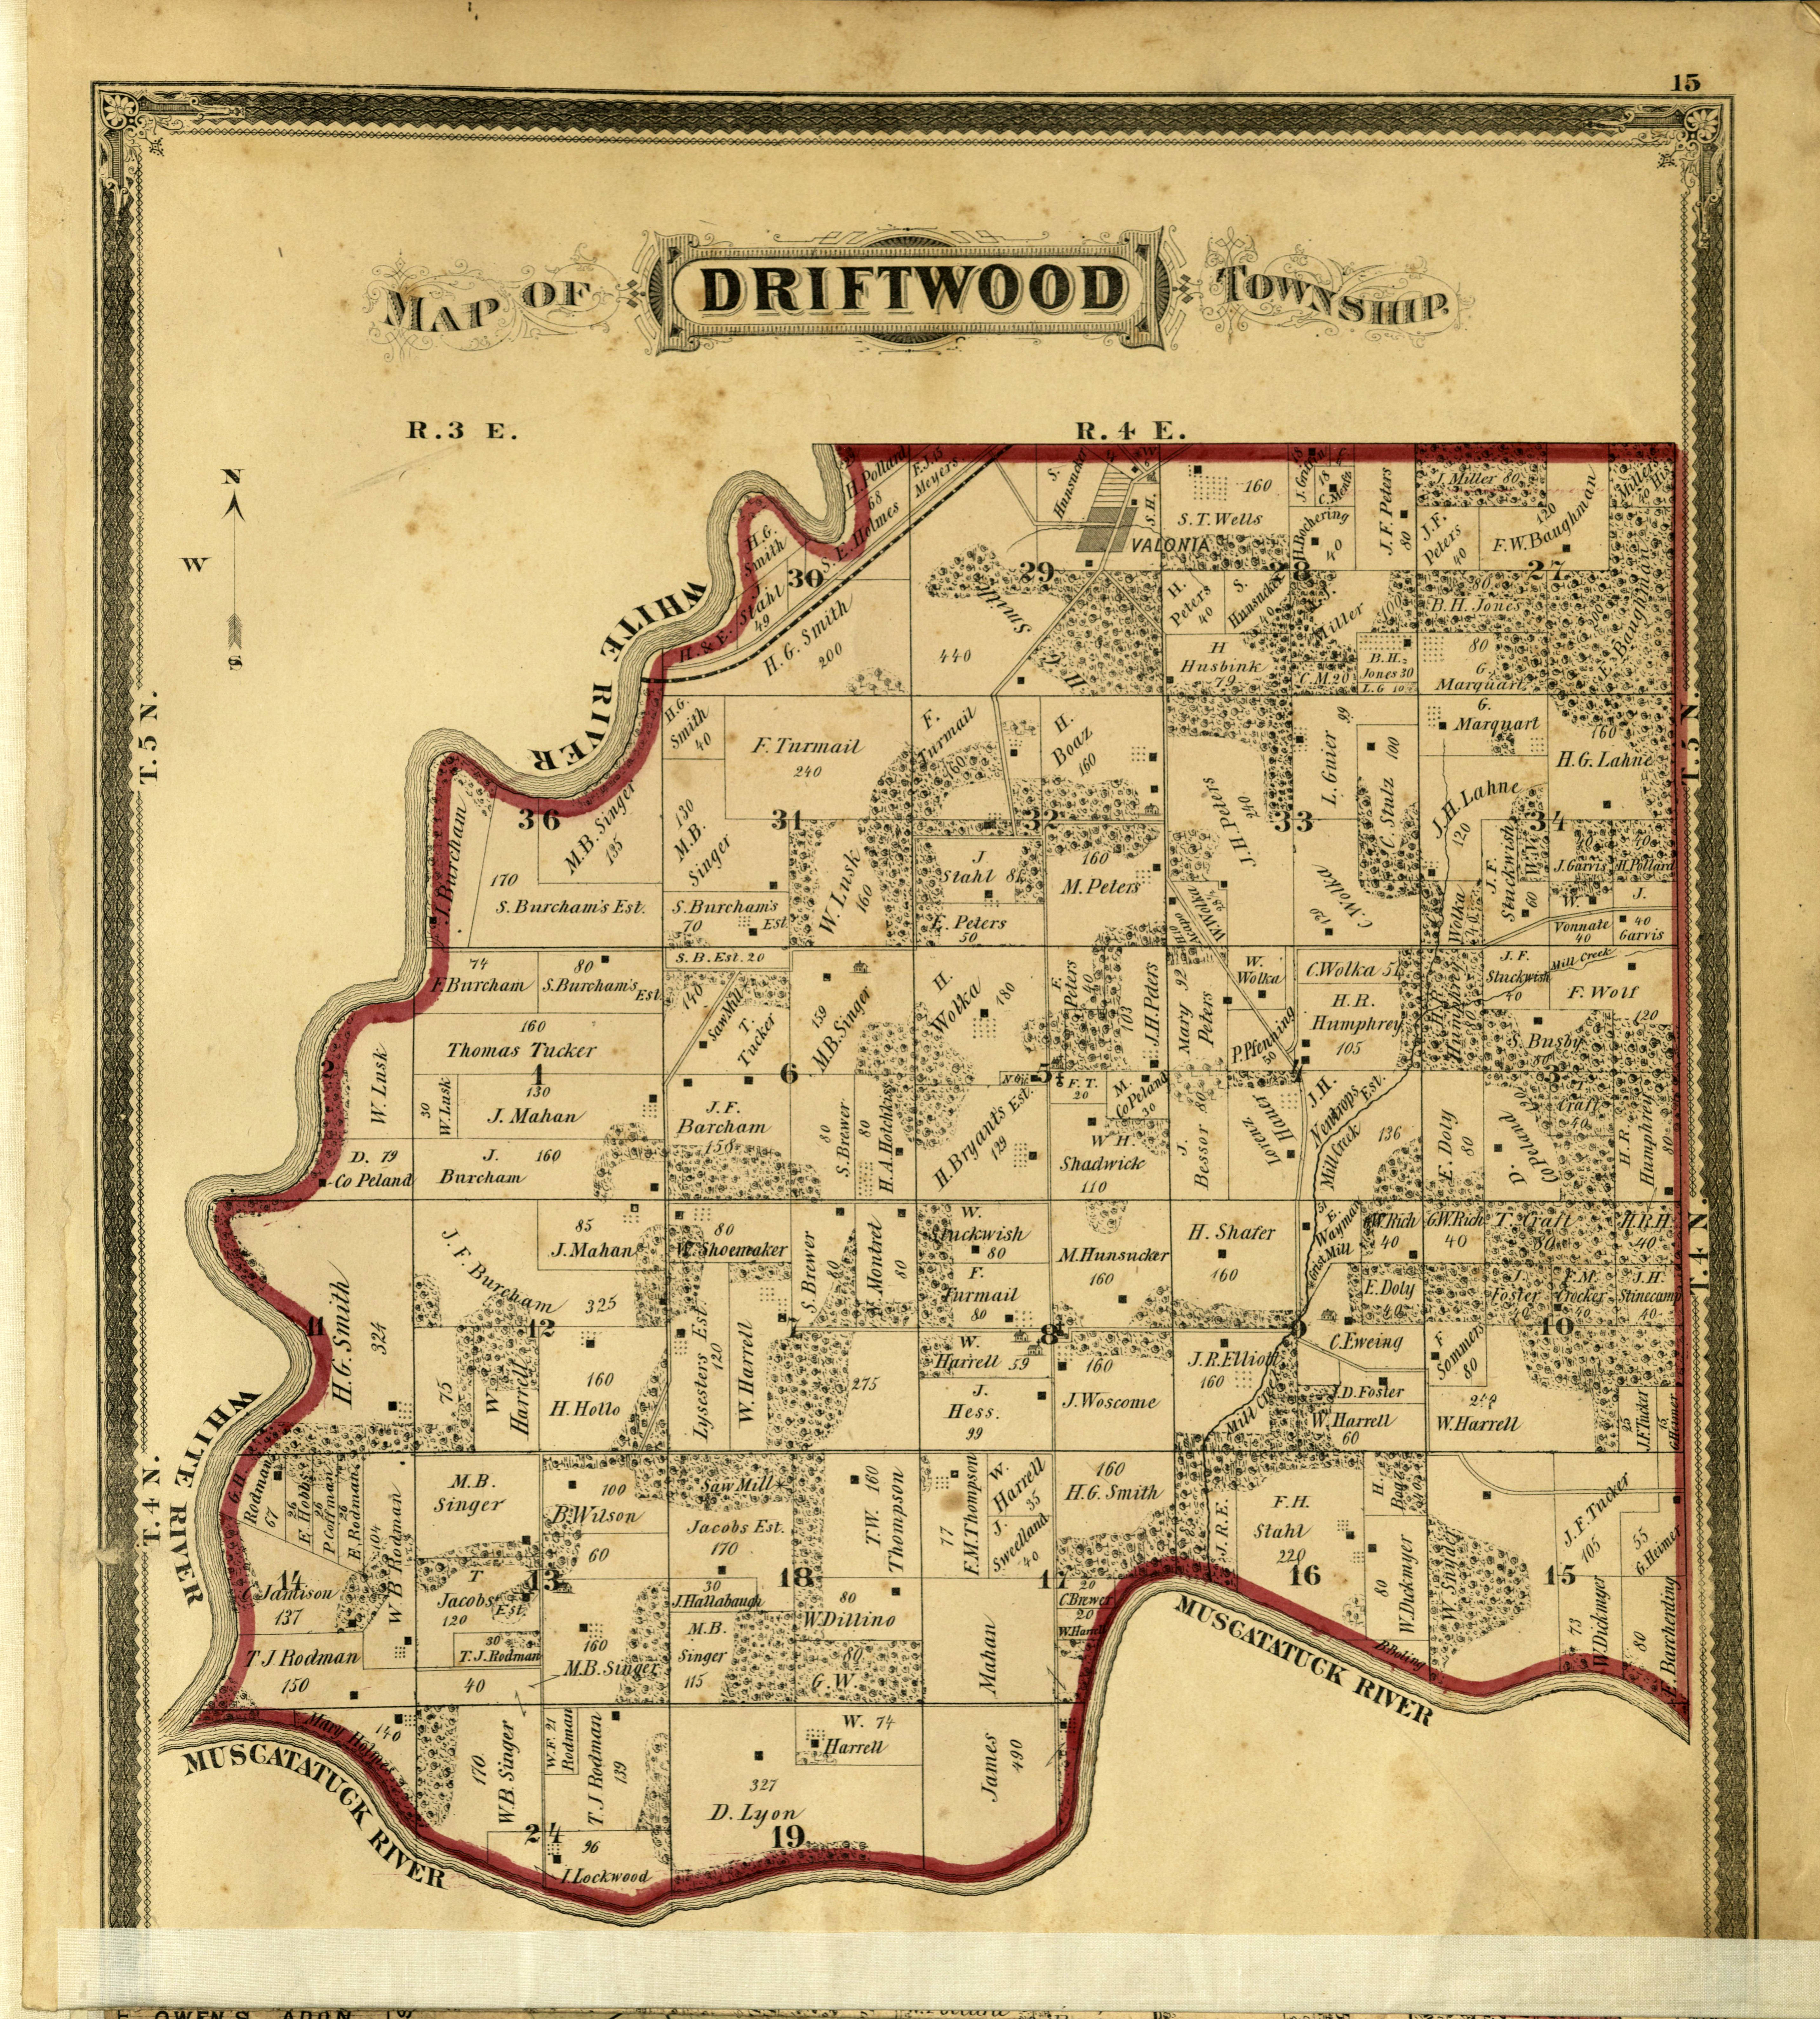
 Other times, the city seems to develop while almost ignoring the river. Columbus seems to just dip a toe into the East Fork of the White River. Indianapolis, too, seems to be shying away from the White River and looking inward toward the circle center. Both of these towns have had interesting relationships with their rivers, but now Columbus Riverfront and Indianapolis are looking for ways to embrace their beautiful waterways.
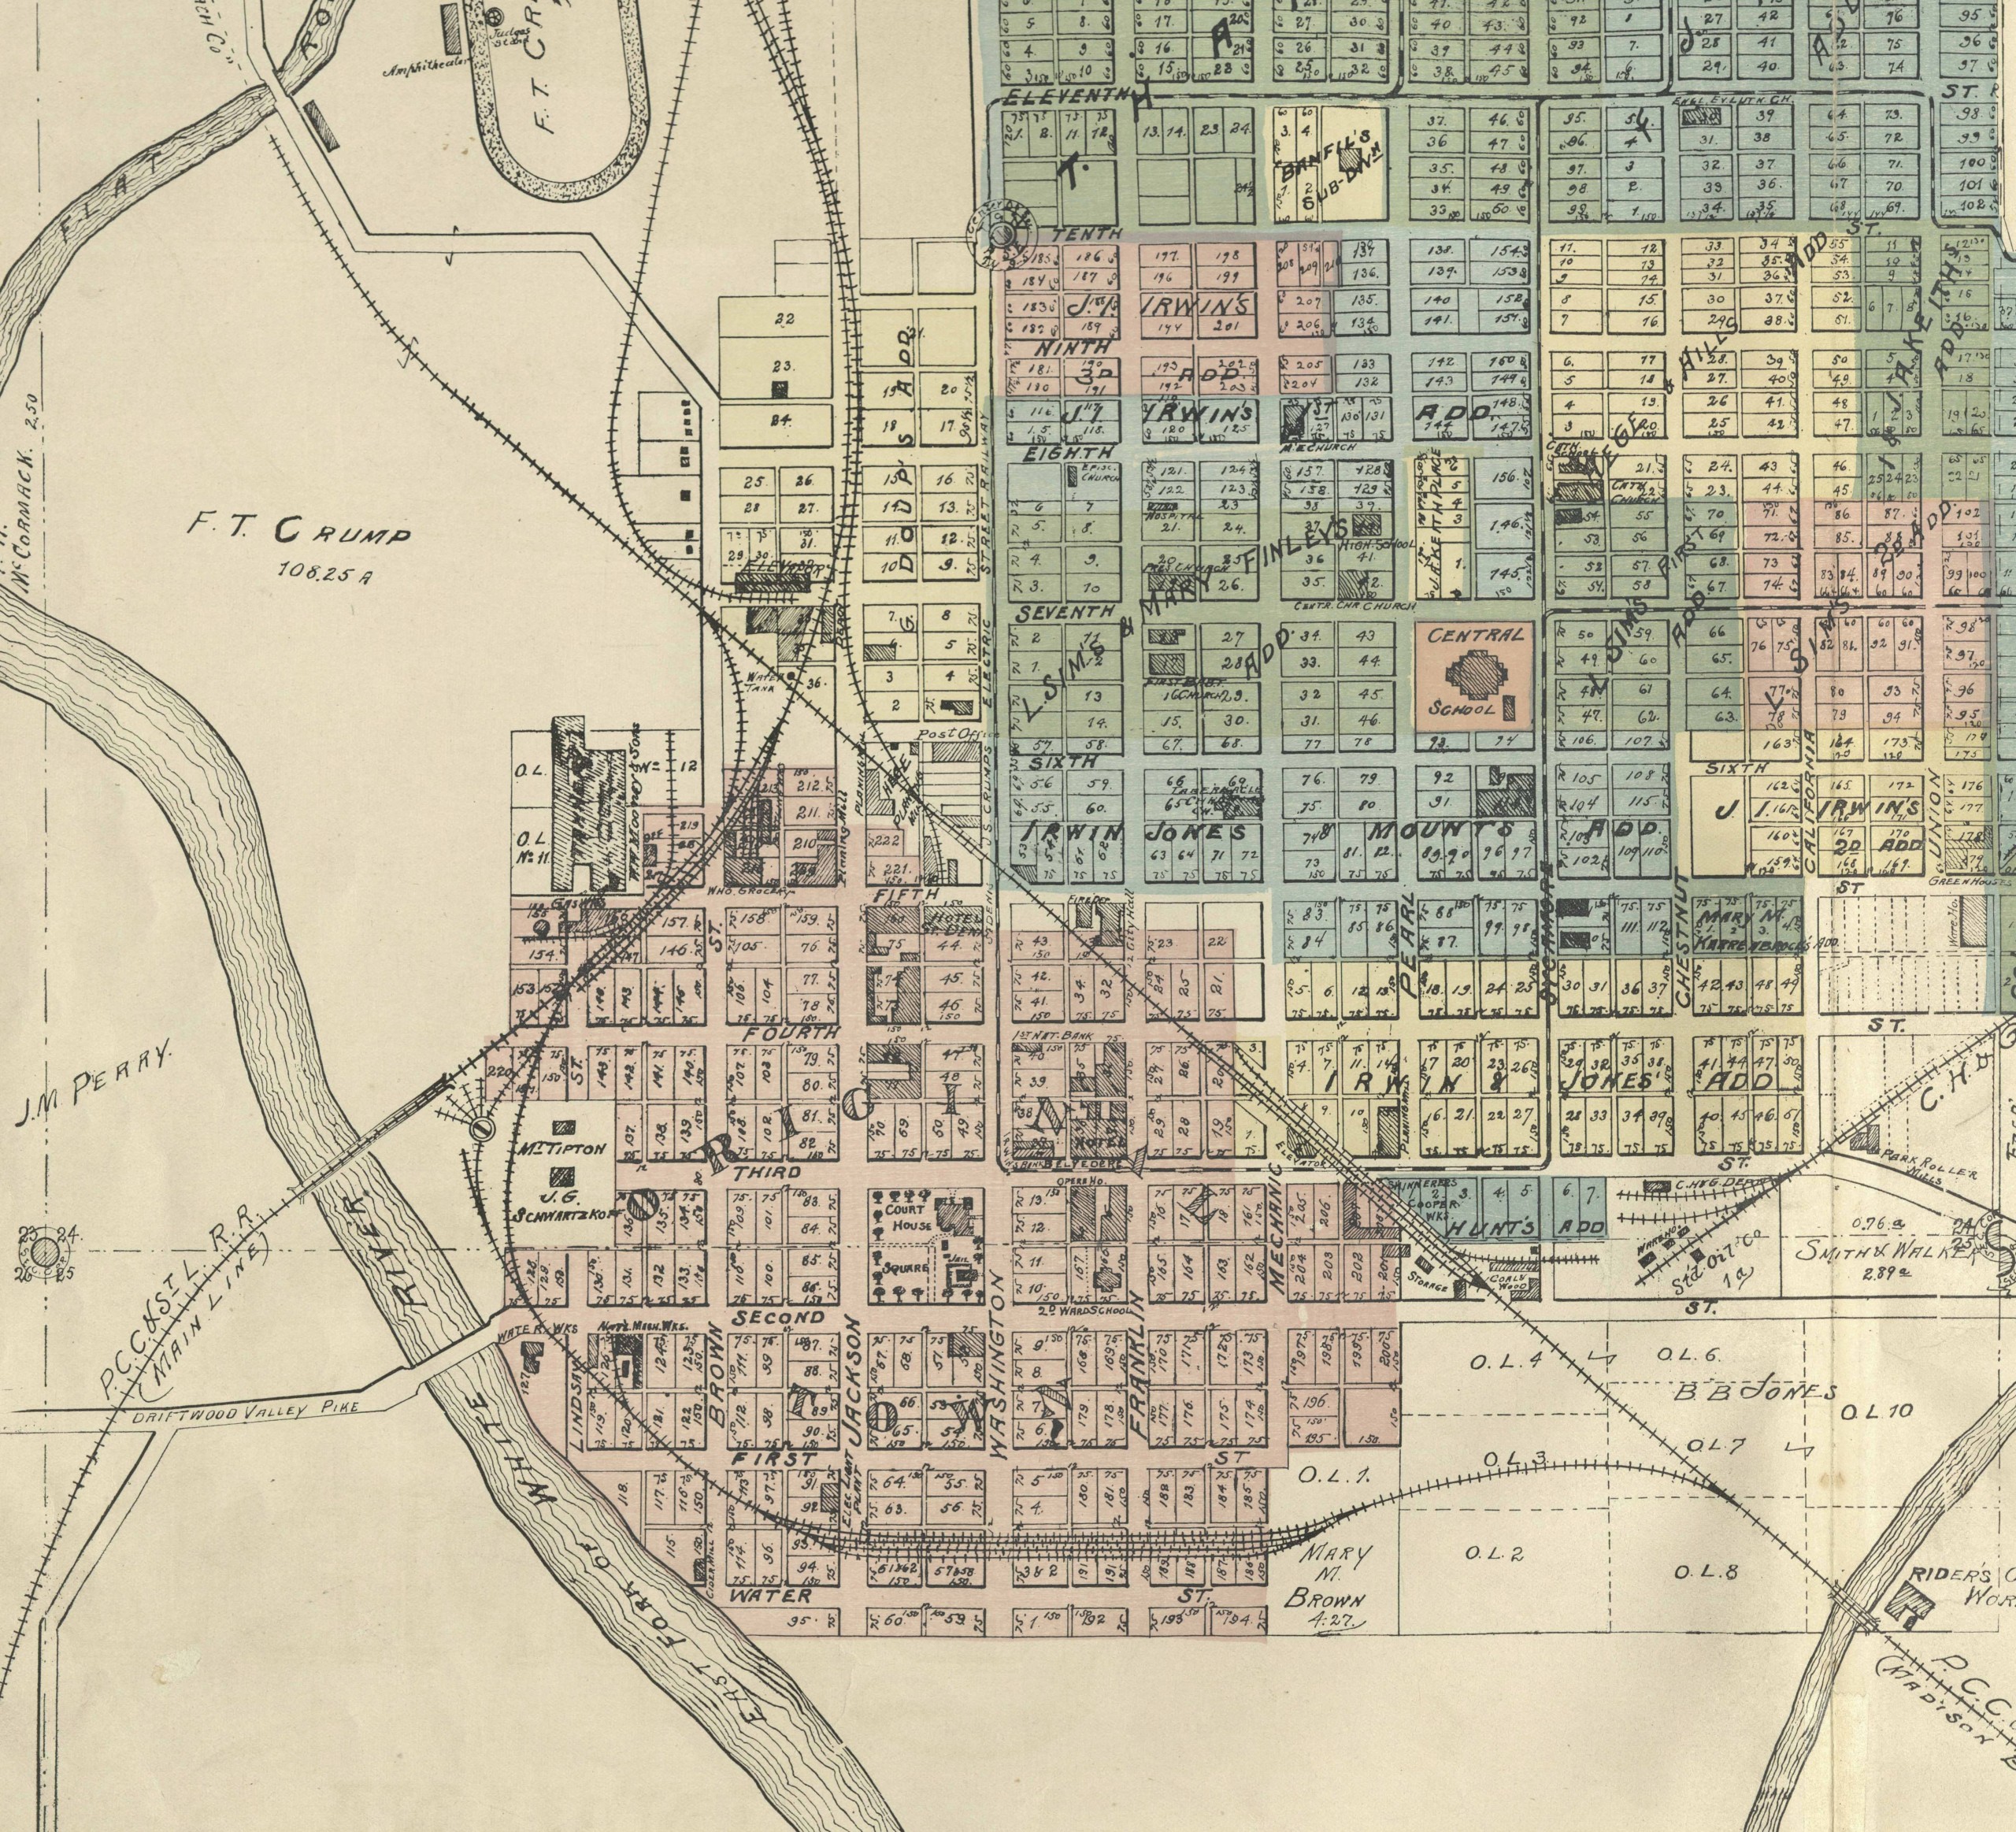
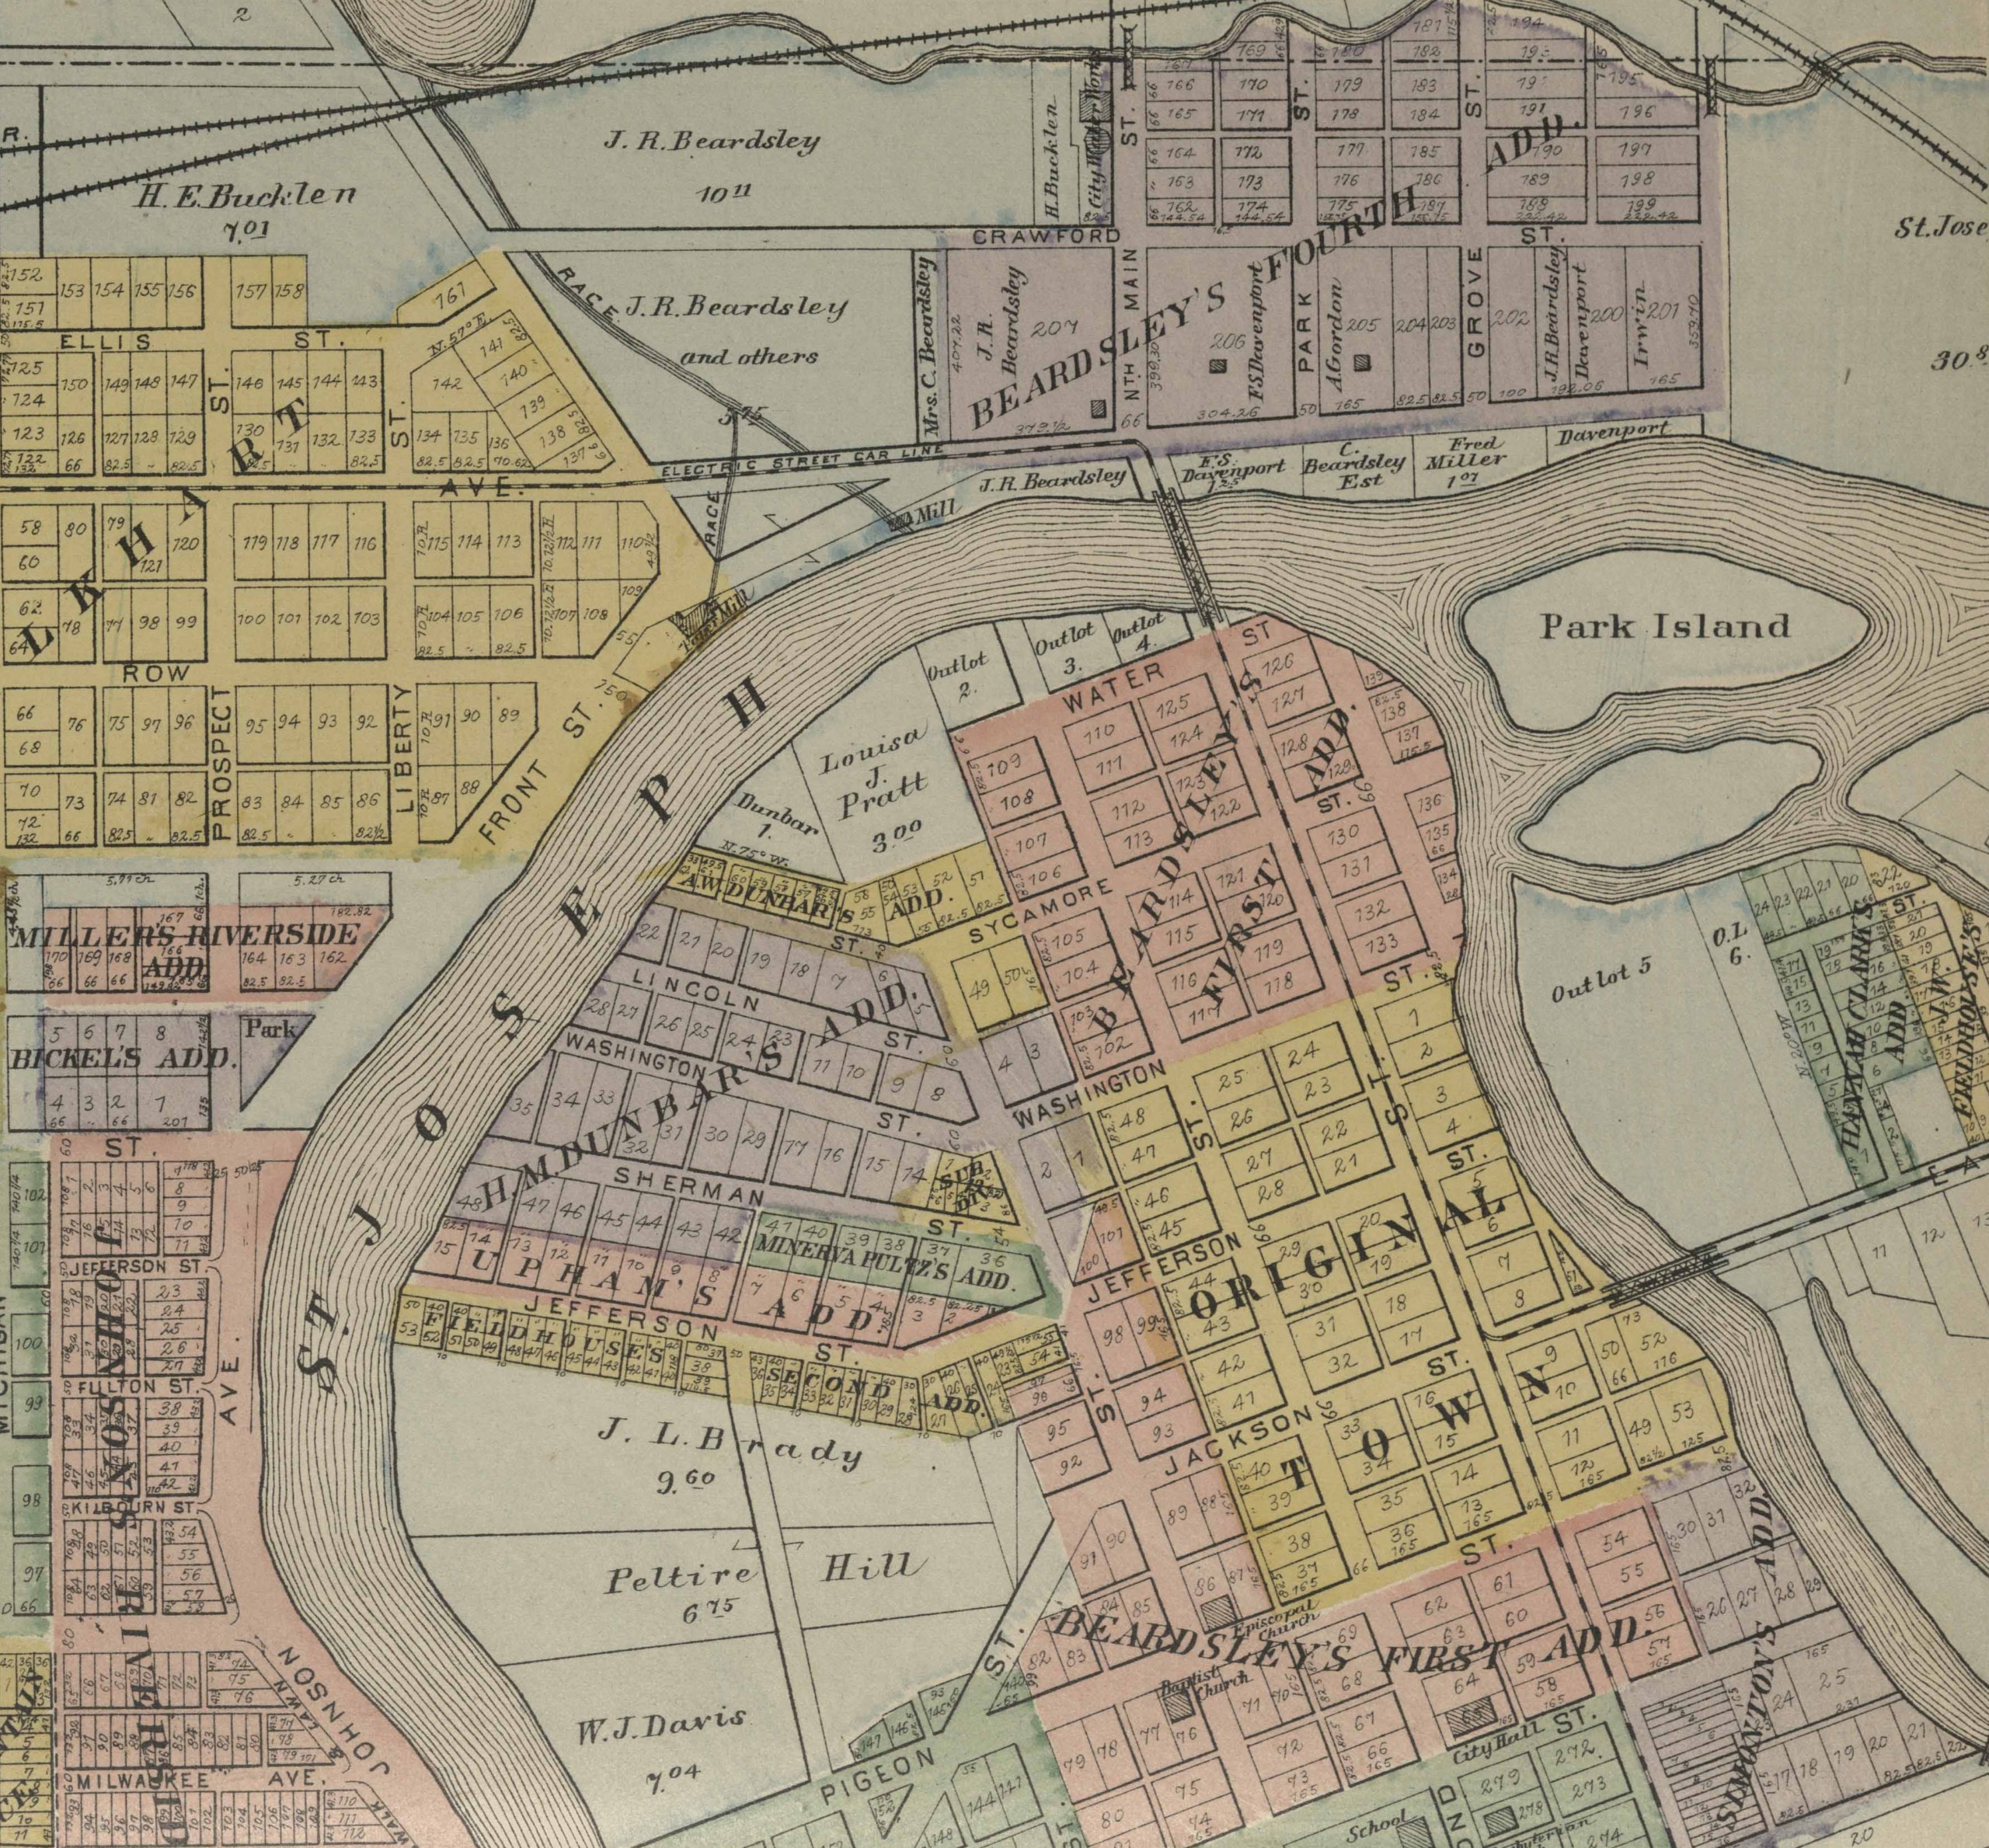
 It seems Logansport’s not afraid to straddle and nestle within the arms of the Wabash and Eel rivers. And Elkhart, too, appears not to have shied away from the St. Joseph and Elkhart Rivers. The river seems to be coming and going, swirling and whirling on the page.
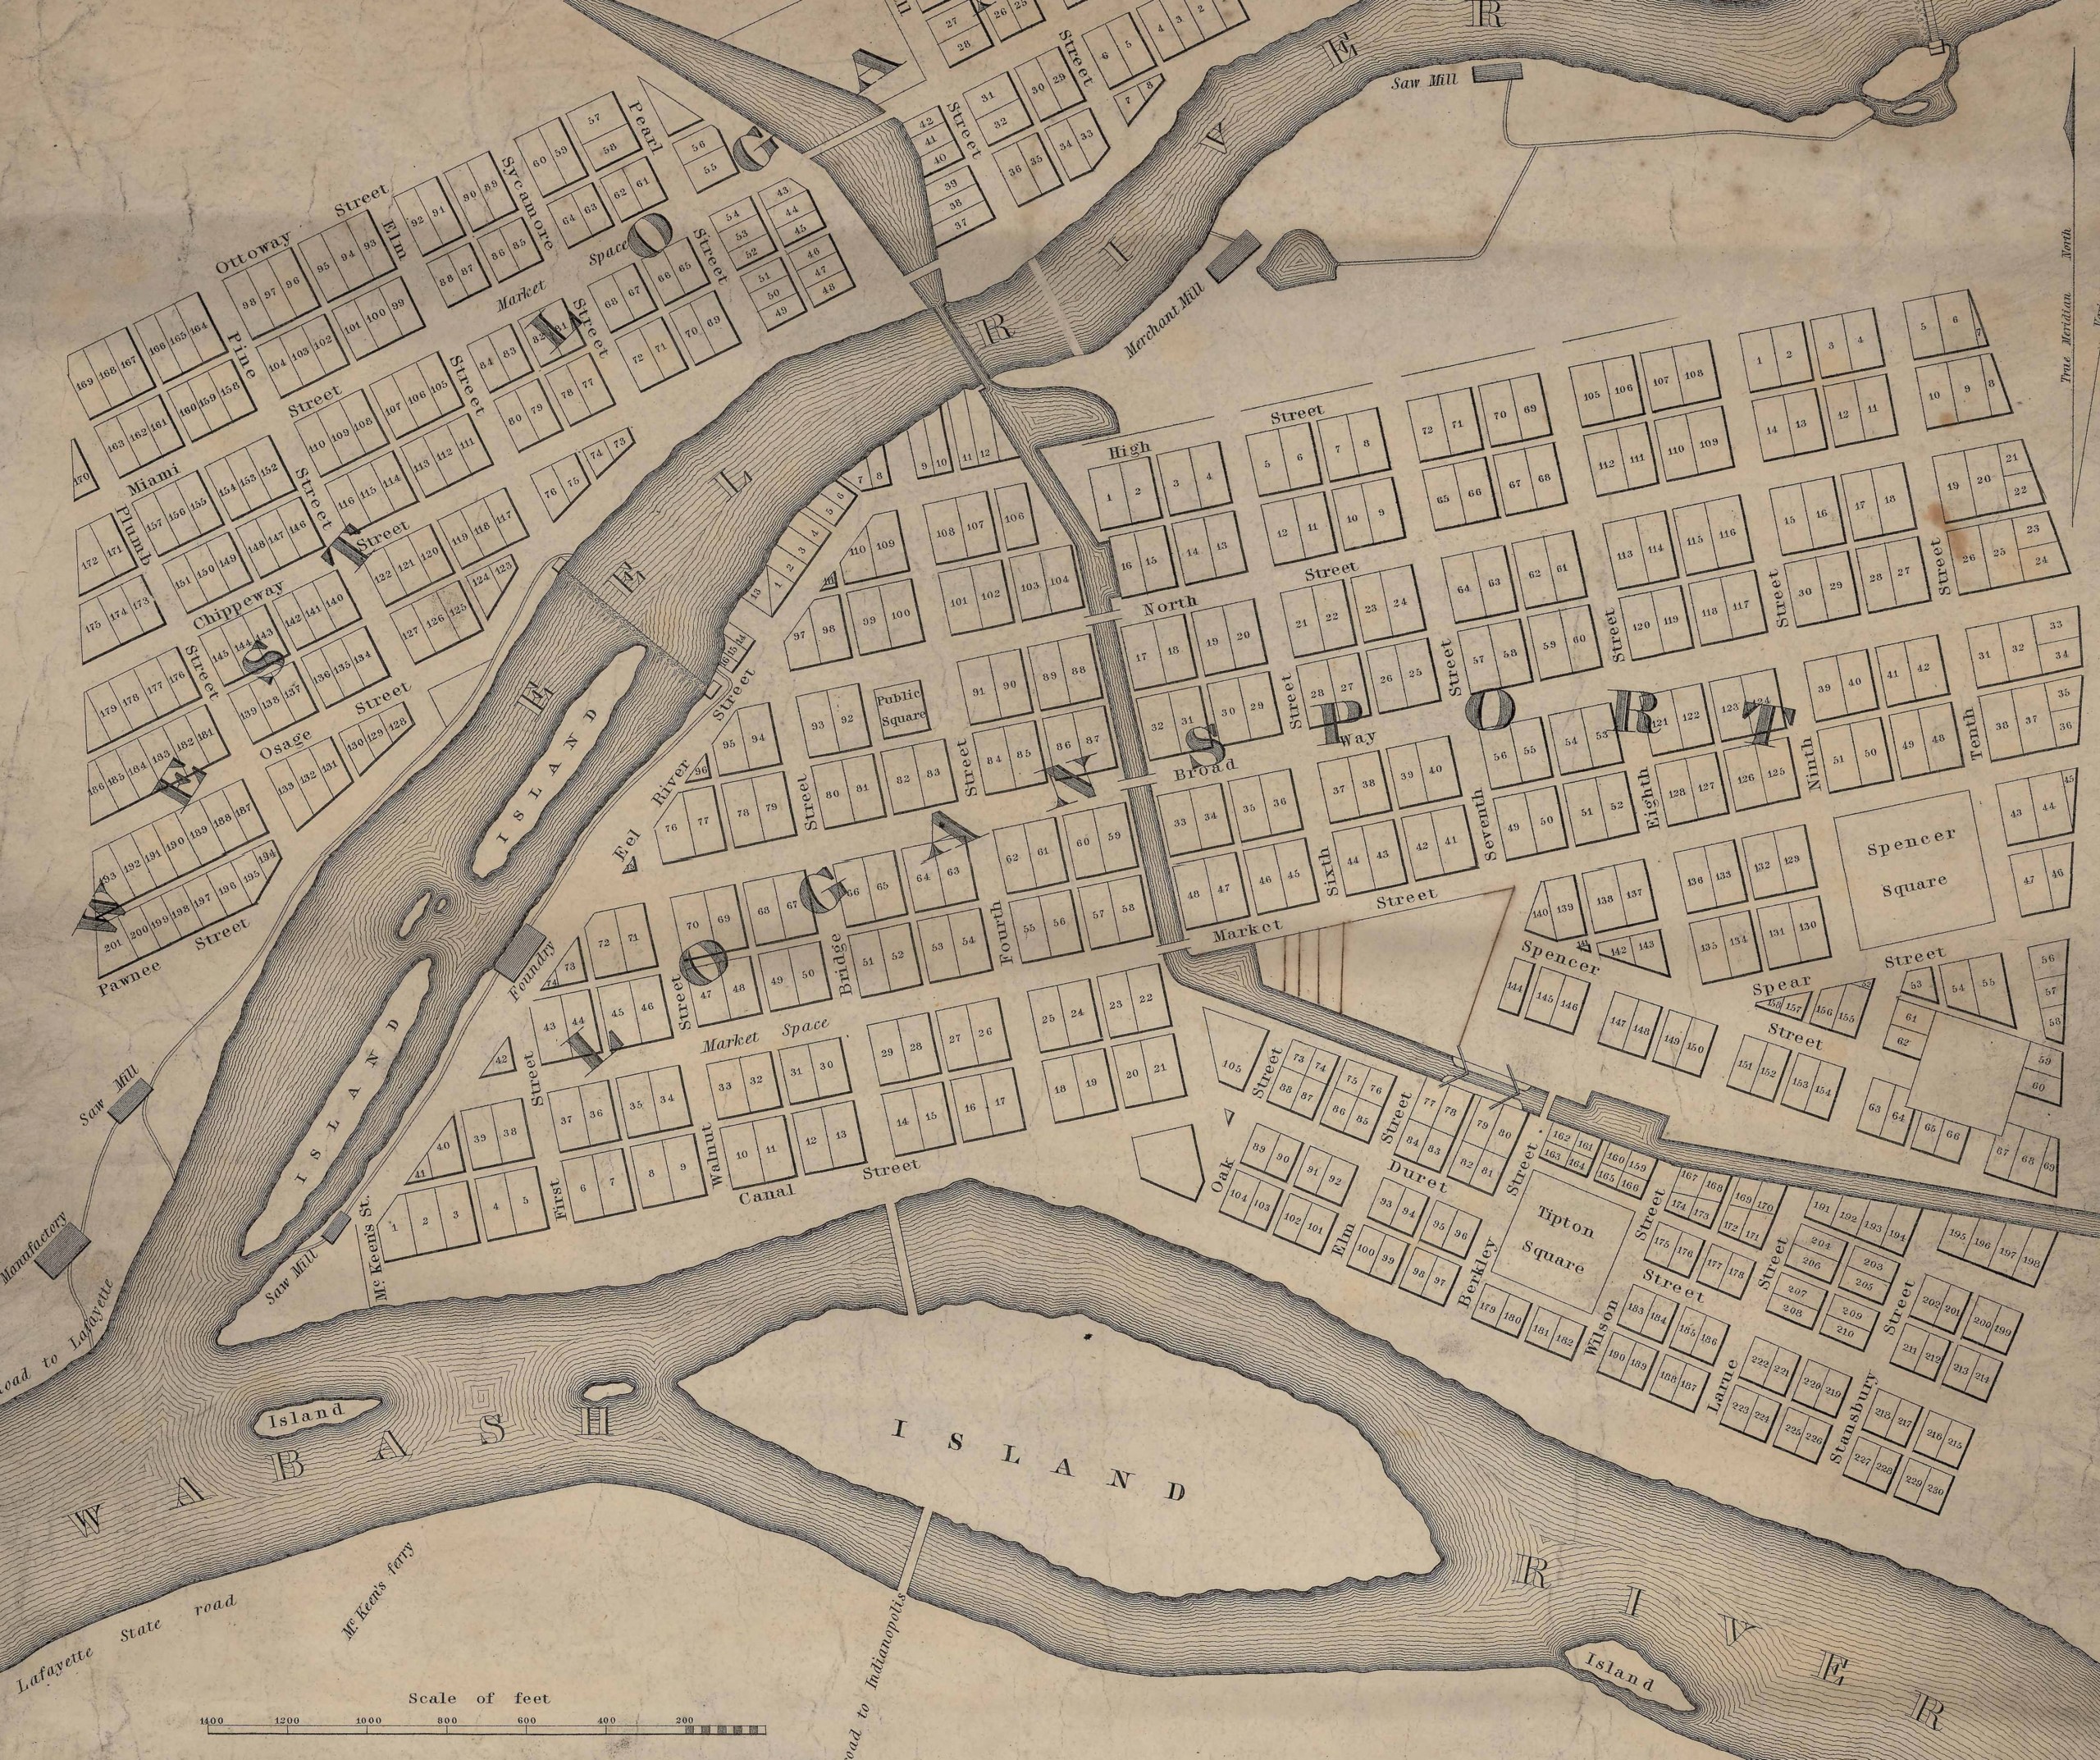
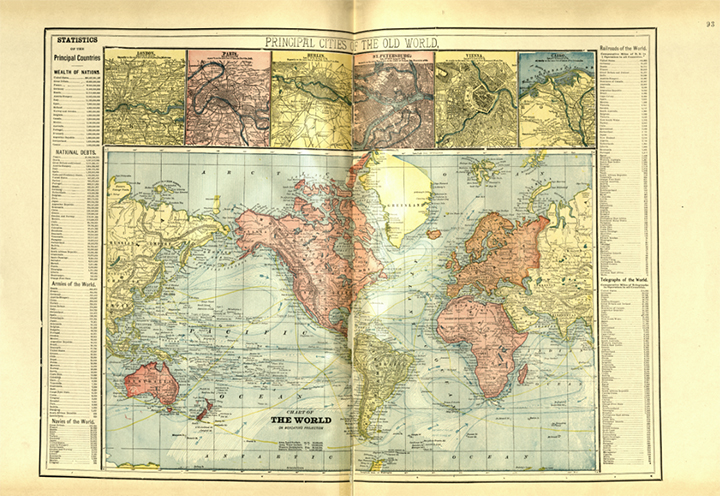
 If you enjoyed looking at these maps, take time to explore some of the great digital map collections available online. Don’t we all need something for our minds to linger on right now?