Every January, Indiana public library directors (or their unlucky designees!) let out a collective sigh as they complete the Indiana public libraries annual report. The survey is lengthy, containing between 600-800 questions (depending on the size of the library), and takes a great deal of time and preparation to complete. However, once the answers are submitted, little is thought about it until it rolls around again the following year. We’d like to share several examples of how the information collected through the report is used the following year and beyond:
Statistics – The resulting Public Library statistics (including the new 2014 statistics) provide data that staff, trustees, and researchers can use to evaluate libraries and make informed decisions. The stats can be used for local or statewide comparisons, or even to compare libraries of similar size/populations (e.g. What’s the average Director salary at Class B libraries? How much are the other libraries in my county circulating?). Our website contains data for the past 20 years.
National Public Libraries Survey – One hundred questions on the survey feed directly to the Public Libraries in the United States Survey. This annual survey gleans information from 9,000 library systems nationwide about their staffing, collections, circulation, revenue and expenditures. The resulting data is used by researchers, journalists, the public, and policymakers at the federal, state, and local levels.
Standards – One of the primary uses for the survey in Indiana is to evaluate Indiana Public Library Standards For example, does the library have enough computers available for the public? Is the library open for a sufficient number of hours? Are they hosting enough programs throughout the year? After this review, Statewide Services staff follow up with the ‘out of standards’ libraries and offer assistance, with the goal of ensuring Hoosiers have sufficient access to library services wherever they live in the state.
Planning – The statistics can be helpful for projections and planning, for example, in budgeting, technology planning, strategic planning, grant writing, or planned expansions. Statistics can help determine the costs of operating per capita, and help libraries to establish their non-resident fees. The statistics are also a great way of finding out what other libraries are up to. For example, in 2014, we asked libraries to report if they have adopted any non-traditional classification systems, or if they have a makerspace.
Directories – The Annual Reports are used to compile and maintain the Public Library Directory, trustee directories, branch directories, Friends and Foundation directories, and interlibrary loan staff directories.
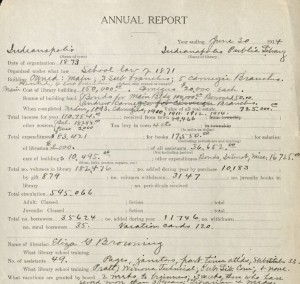
Historical research – Since the Annual Report has been collected for a century, there are decades of data and stories to be told by the old surveys. They list former library locations, expenditures, collection sizes, librarian and trustee names, and more. Through the old reports, you can follow a library as it evolves from its inception, to their Carnegie building, and possibly on to an entire municipal system.
 1914 Indianapolis Public Library Annual Report
If you have an idea for a question that should be included in next year’s Annual Report, or if you are interested in serving on the advisory committee, please contact me at jclifton@library.in.gov. I’d also love to hear stories of how you were able to put the stats to use!
This blog post was written by Jen Clifton, Public Library and LSTA Consultant, Indiana State Library. For more information, contact the Library Development Office at (800) 451-6028 or visit our webpage at http://www.in.gov/library/libraries.htm.
