
It’s a valuable thing – to be able to predict the future.
We all do it. We predict what might happen during our day, and we dress ourselves based on that prediction. We predict what the weekend might look like as we look forward to it. We predict which of our teams might win in the next big game.
One of the most important things statistics can do is project future statistics. We make important decisions based on projected numbers. In fact, it’s vital that we’re able to do this mathematically. It has become the basis for planning and policy.
So, what do you need to know about statistics to be able to anticipate the next month’s, next year’s or next decade’s economic forecast?
If you’re like me, you were required to take an economics course to graduate high school in Indiana, but the class didn’t delve into complex theories. Today’s lexicon requires that we know a few basic terms, even to understand the daily news. So, here is a resource guide to ensure you’re ready to read today’s market and follow its daily fluxuations.
In additional to the resources found in the guide below, researchers can consult with the Indiana State Data Center and our state partner agencies at any time by submitting a request 24/7 here.

Beige Book, formerly known as the Red Book
The Beige Book is a report published by the Federal Reserve. It summarizes economic activity and conditions by sector, and is organized by the 12 Federal Reserve Districts.
CPI, PPI, market basket
The U.S. Bureau of Labor Statistics issues the Consumer Price Index, or CPI, for each month at the end of the month. It shows the changes in prices for major consumer categories like food and energy. It can show how the buying power of the dollar increases and decreases over the years. The CPI measures a market basket of items, or purchases of goods and services that usually happen together. For examples of these goods and services, visit Content of CPI Entry Level Items.
The Producer Price Index, or PPI, was once known as the wholesale price index. It measures prices received by producers, before goods and services reach the consumer.
Cost of Living Index and Calculator
The Cost of Living Index, or COLI, differs from the CPI in that it compares basic expenses between specific geographic areas. These measures are produced by the Economic Policy Institute and the Council for Community and Economic Research (C2ER).
The Indiana DWD provides a Cost of Living Calculator on HoosierData.IN.gov.
Dow Jones Industrial Average (DJIA) and S&P 500
The Dow Jones, incorporated in 1896, is a measure of the U.S. stock market containing the prices of 30 large cap stocks, which trade at $10 billion or more, while the Standard and Poor (S&P) 500 index measures 500 large cap U.S. stocks. Both indexes are used as general indicators of the financial health of the stock market. Current S&P 500 stocks represent 11 economic sectors classified by the Global Industry Classification Standard.
 Economic Agencies and Organizations
Indiana Business Research Center (IBRC) Kelley School of Business at Indiana University
Indiana Economic Development Corporation (IEDC)
Indiana Department of Workforce Development (DWD)
National Bureau of Economic Research (NBER)
U.S. Bureau of Economic Analysis (BEA)
U.S. Bureau of Labor Statistics (BLS)
U.S. Census Bureau
U.S. Federal Reserve System, “The Fed”
Economic Publications
Indiana Business Review Indiana Business Research Center
InContext Indiana Business Research Center
Indiana Economic Digest
Liberty Street Economics Federal Reserve Bank of New York
Monthly Labor Review U.S. Bureau of Labor Statistics
Survey of Current Business U.S. Bureau of Economic Analysis
GDP, GNP, NNP
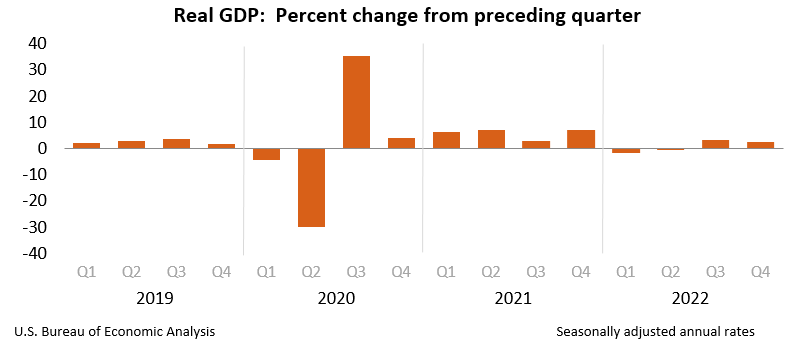
The real gross domestic product (GDP) is the volume level of GDP, which is the value of goods and services produced in a year within a country adjusted for inflation. Find quarterly GDP data for the U.S. using the Bureau of Economic Analysis (BEA) website and the FRED GDP page.
GNP is the value of goods and services within a certain country produced by the residents of that country, wherever those goods and services are. It is the GDP plus foreign investments.
NNP, or the net national product, is the GNP corrected for depreciation.
Inflation and recession
By definition, an economic recession occurs when the real GDP falls for two consecutive quarters. However, economists can differ in their descriptions of what constitutes a recession. That’s why it’s important to pay attention to the rulings of the Federal Reserve Board, also known as The Fed.
Inflation is a rise in prices over a period of time. Inflation happens naturally over time, but during certain periods, the rate of inflation is higher. You can measure the rate of inflation going back to 1913 with the Bureau of Labor Statistics CPI Inflation Calculator.
Unemployment rate and labor participation
The labor force participation rate, measured by the Bureau of Labor Statistics (BLS), is made up of the employed and the unemployed. A third category of workers are those who are not participating in the labor force (unemployed and not seeking work). See the BLS Employment & Unemployment webpage for current U.S. data and HoosierData.IN.gov for current Indiana data.
Hopefully, these resources will aid researchers as they seek out important economic information.
This blog post was written by Katie Springer, reference librarian. For more information, contact the Reference and Government Services Division at 317-232-3678 or submit an Ask-A-Librarian request.
Sources:
“A Guide to Everyday Economic Statistics,” by Gary E. Clayton and Martin Gerhard Giesbrecht.