
The Indiana State Library’s Government Information Minute on Aug. 18 detailed the Census Bureau’s redistricting data release and gave the locations of several sources for the new data.
![]()
While it’s clear this data matters to demographers, local leaders and policy-makers, how does it apply to us as lifelong learners, the general public and the library community?
A first look at the data shows significant changes in the U.S. population taking place over the last ten years, from 2010 to 2020. While it is too early to tell the impact of COVID and new privacy methods on the national census, the new data says:
- The number of people who identify as Native American or Alaska Native – in combination with another race – rose more than any time in history between censuses. See 2020 Census Illuminates Racial and Ethnic Composition of the Country: “…the American Indian and Alaska Native alone or in combination population comprised 9.7 million people (2.9% of the total population) in 2020, up from 5.2 million (1.7%) in 2010.”
- The number of people who describe themselves as two or more races has increased more than any time in history, while the number of people who describe themselves as white has decreased. See 2020 Census Statistics Highlight Local Population Changes and Nation’s Racial and Ethnic Diversity: “The Multiracial population was measured at 9 million people in 2010 and is now 33.8 million people in 2020, a 276% increase.”
What makes these population changes so pertinent right now? The nature of diversity in the United States is expanding. Our identity as Americans, in a place where 331.4 million people made their homes in 2020, is reckoning with its past and looking toward its future. These new numbers inform the news we read, the fiction that entertains us, and the media we absorb. Recent events tell us the changing racial and ethnic makeup of the nation’s population affect each of us.
Use the 2020 Census Demographic Data Map Viewer to look for yourself. It allows you to see diversity in race, Hispanic/Latino ethnicity and age groups state by state. You can also read recently released publications and view the following data visualizations from the Census Bureau about population changes between 2010 and 2020.
Publications:
2020 Census: Racial and Ethnic Diversity Index by State
2020 Census Statistics Highlight Local Population Changes and Nation’s Racial and Ethnic Diversity
2020 United States Population More Racially Ethnically Diverse Than 2010
Improvements to the 2020 Census Race and Hispanic Origin Question Designs, Data Processing, and Coding Procedures
Measuring Racial and Ethnic Diversity for the 2020 Census
Race and Ethnicity in the United States: 2010 Census and 2020 Census
Data Visualizations:
Racial and Ethnic Diversity in the United States: 2010 Census and 2020 Census
U.S. Decennial Census Measurement of Race and Ethnicity Across the Decades: 1790–2020
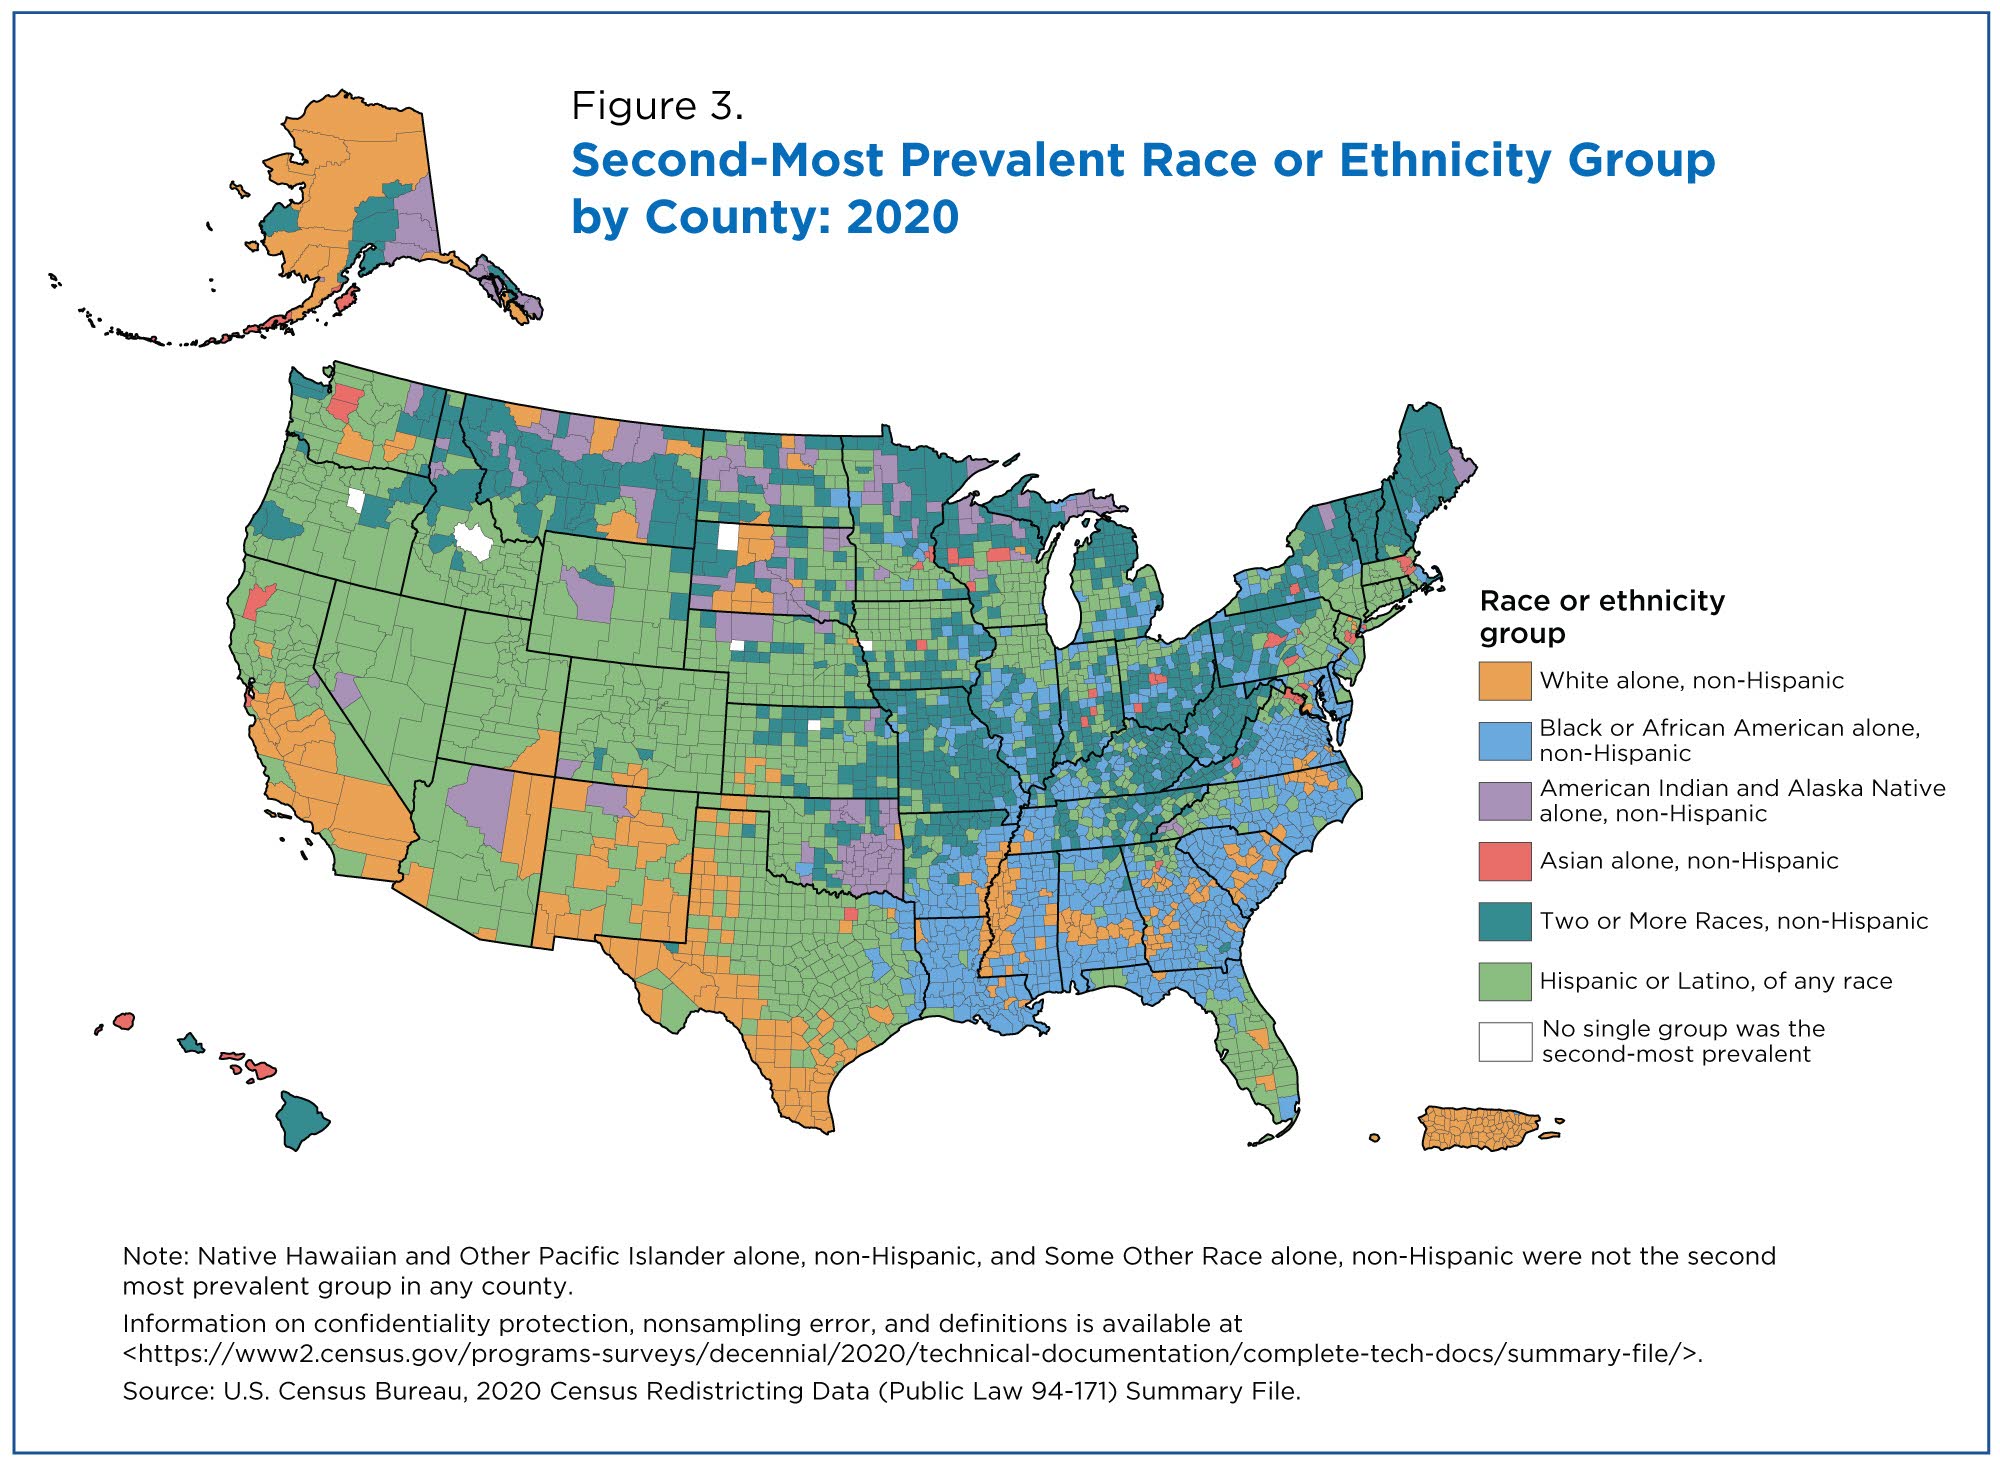
In Indiana, according to the Census Bureau’s Diversity Index, there is a 41.3% chance that two people chosen at random in this state will be from a different racial and ethnic group from each other. While this is not as high on the Diversity Index as California, near the top at 69.7%, it is a much greater chance than in Maine, near the bottom at 18.5%. Hoosiers are in the middle of a shifting state of demography which varies county by county. See the Census Bureau’s map, Second-Most Prevalent Race or Ethnicity Group by County: 2020, from The Chance That Two People Chosen at Random Are of Different Race or Ethnicity Groups Has Increased Since 2010.
 As states participate in the redistricting process, decisions matter at the local level. Indiana’s General Assembly website details Indiana’s redistricting process. Public meetings were held at cities across the state from Aug. 6-12 representing each of Indiana’s nine U.S. Congressional Districts. You can watch the meetings on the website. Members of the public can also draw their own maps to contribute to the process. Locations for this will be at 19 Ivy Tech campuses. Ivy Tech librarians will help people use special software. Video instruction will be available on the website as well. More details will follow on the website.
Indiana libraries participated fully in the U.S. census despite COVID disruptions. As the pandemic changed everyone’s plans, we changed our approach to census outreach. Librarians directed energy and knowledge toward census promotion from 2019 through a census year with a changing timeline. Our displays were up. We posted on social media instead of having live events to encourage response. We showed our communities how important it was to answer, and how much easier it was to complete online. When it was safe, we welcomed the public to use our computers to fill out the census. These sincere efforts during disquieted times are what make our libraries the best.
The changing face of diversity, as the story is told by the census, continues its thread through our libraries as well. Following in the steps of the corporate world, libraries are hiring diversity and inclusion officers and holding programs that challenge patrons to think seriously about current events. We all have a role to play in the future of our communities. What will yours be?
This blog post by Katie Springer, reference librarian. For more information, contact the Reference and Government Services Division at 317-232-3678 or submit an Ask-A-Librarian request.
