Recently, a professor in the Department of Wildlife Ecology and Conservation at the University of Florida contacted me about our copy of “Frog Raising for Pleasure and Profit.” First written as a series of pamphlets in the 1930s, the title was eventually published as hardback books beginning in the 1950s. The professor and his colleagues were not even aware of a 1960 edition, which we have here at the Indiana State Library. As he stated, “My co-author and I have scanned libraries, book stores, online services, etc. for a long time and have been unable to find another copy with that date.” That we had such an unusual book, immediately led me down the research rabbit hole.
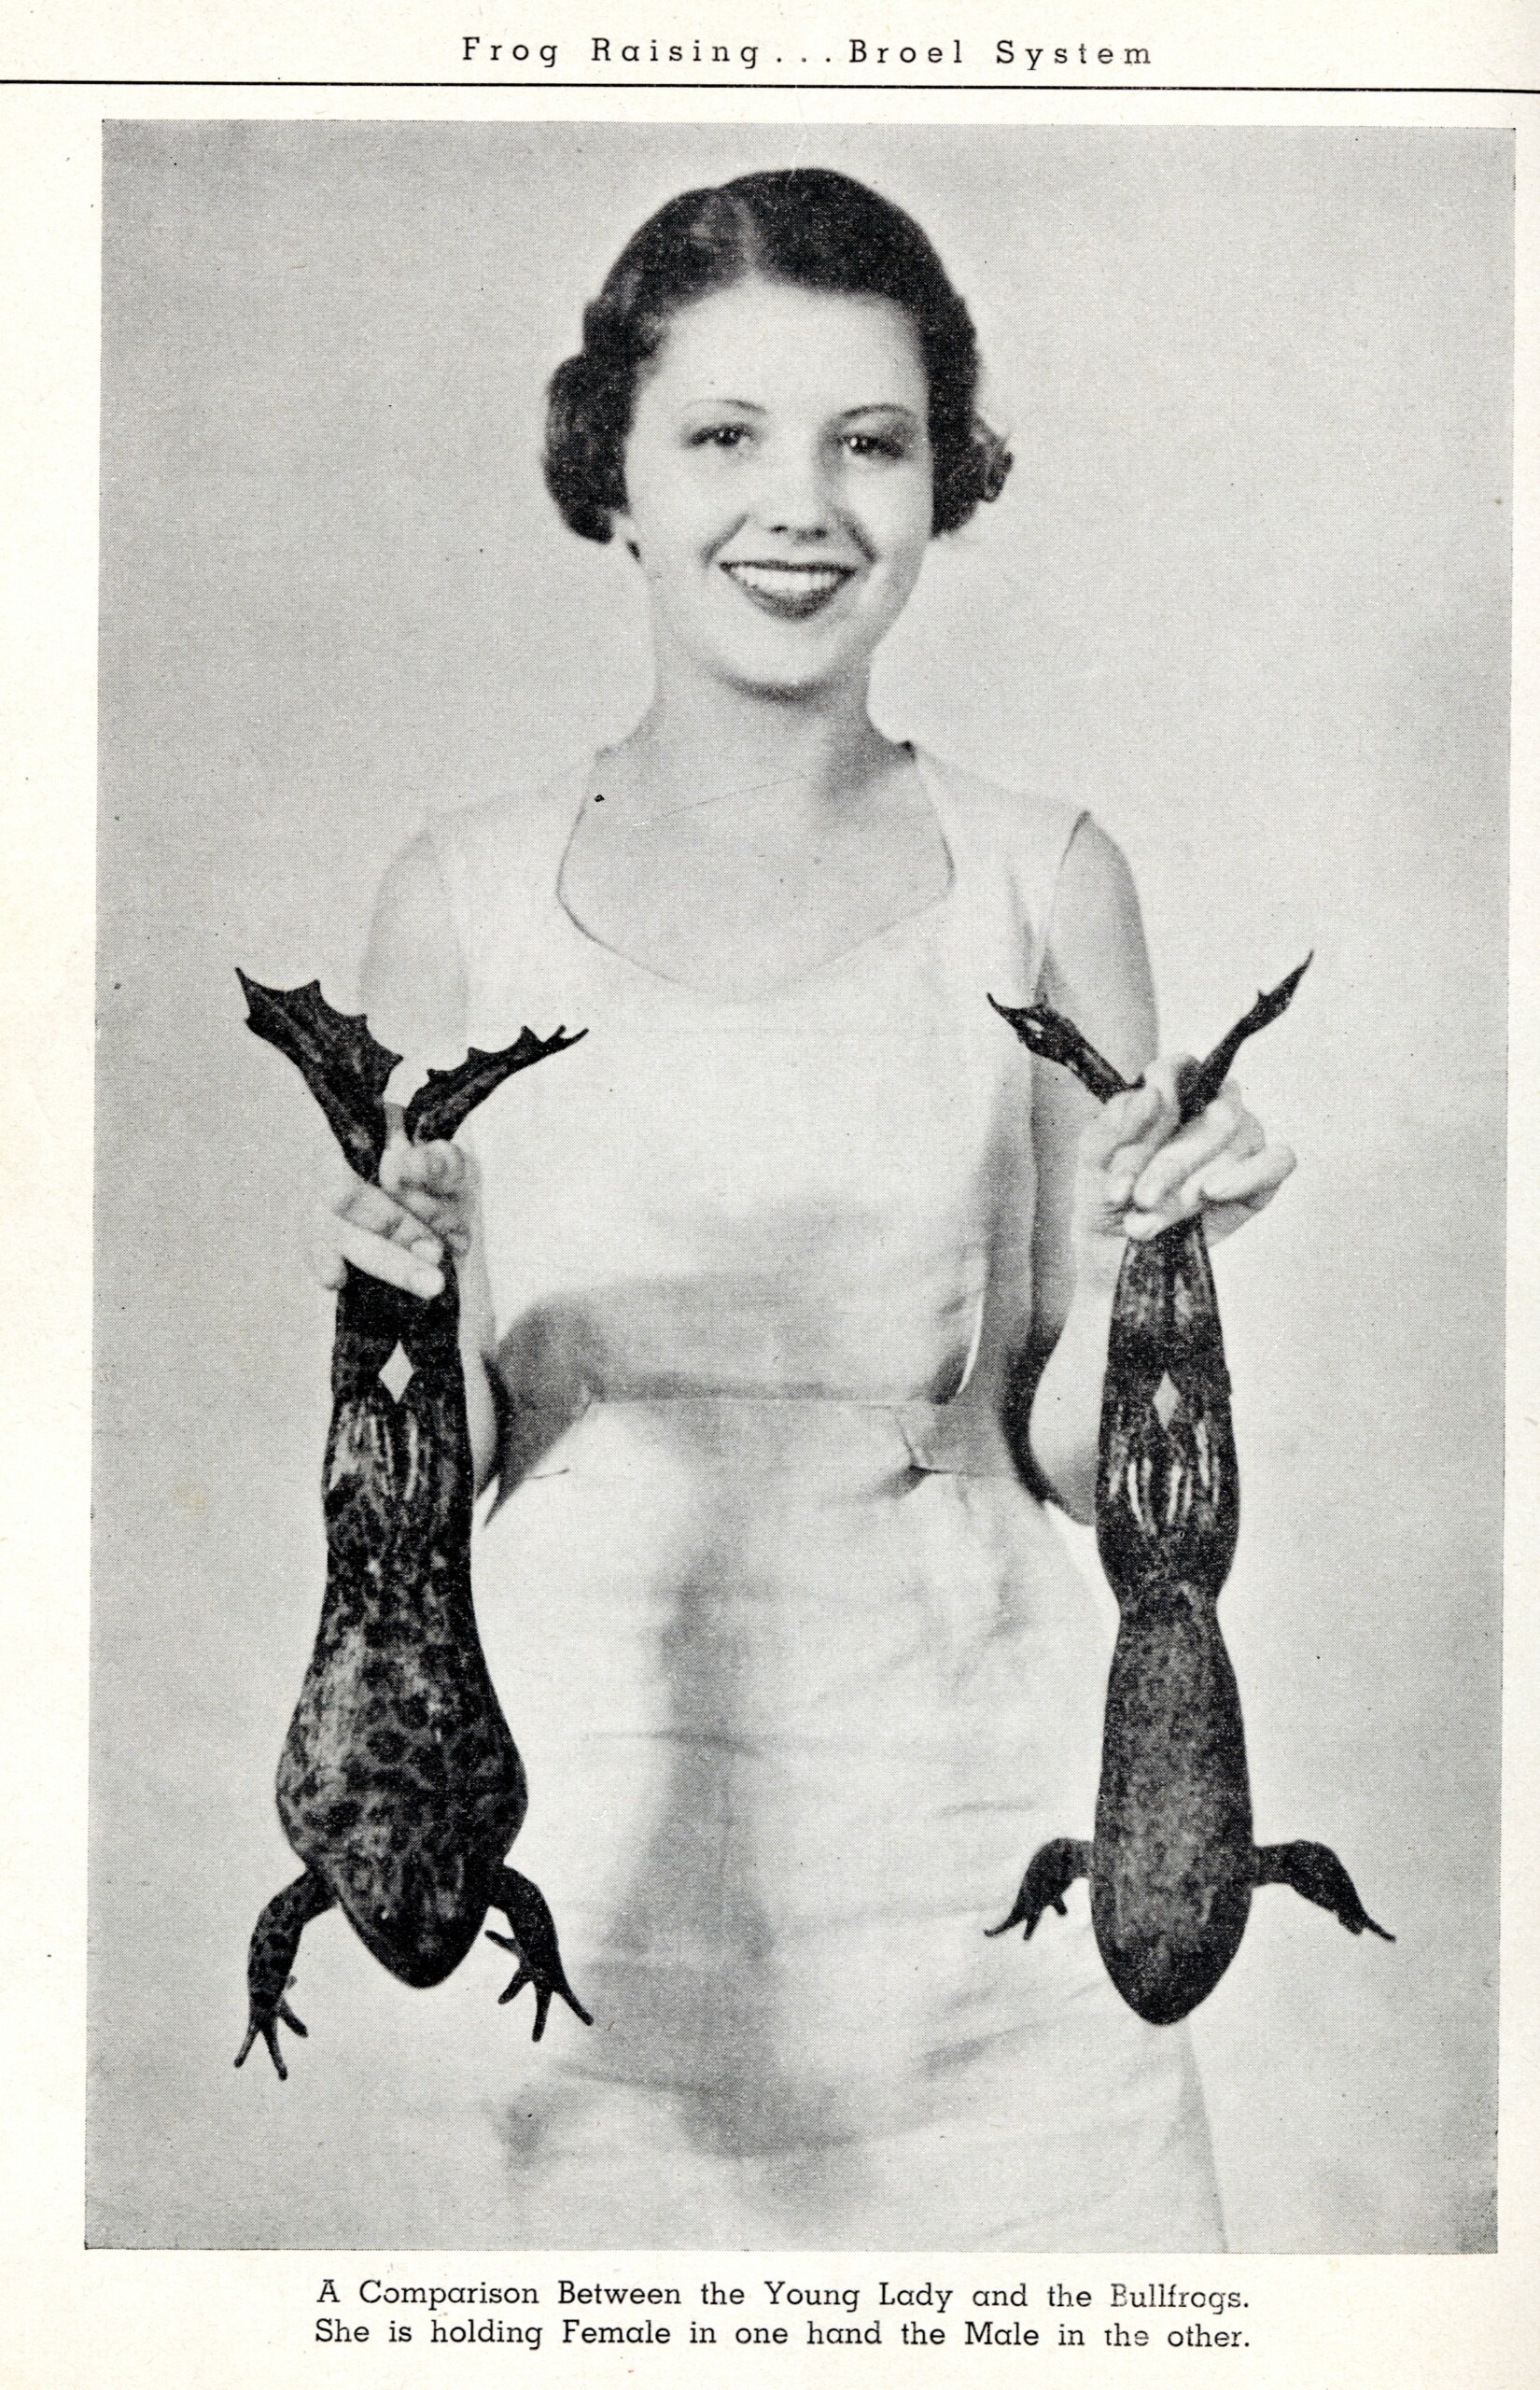
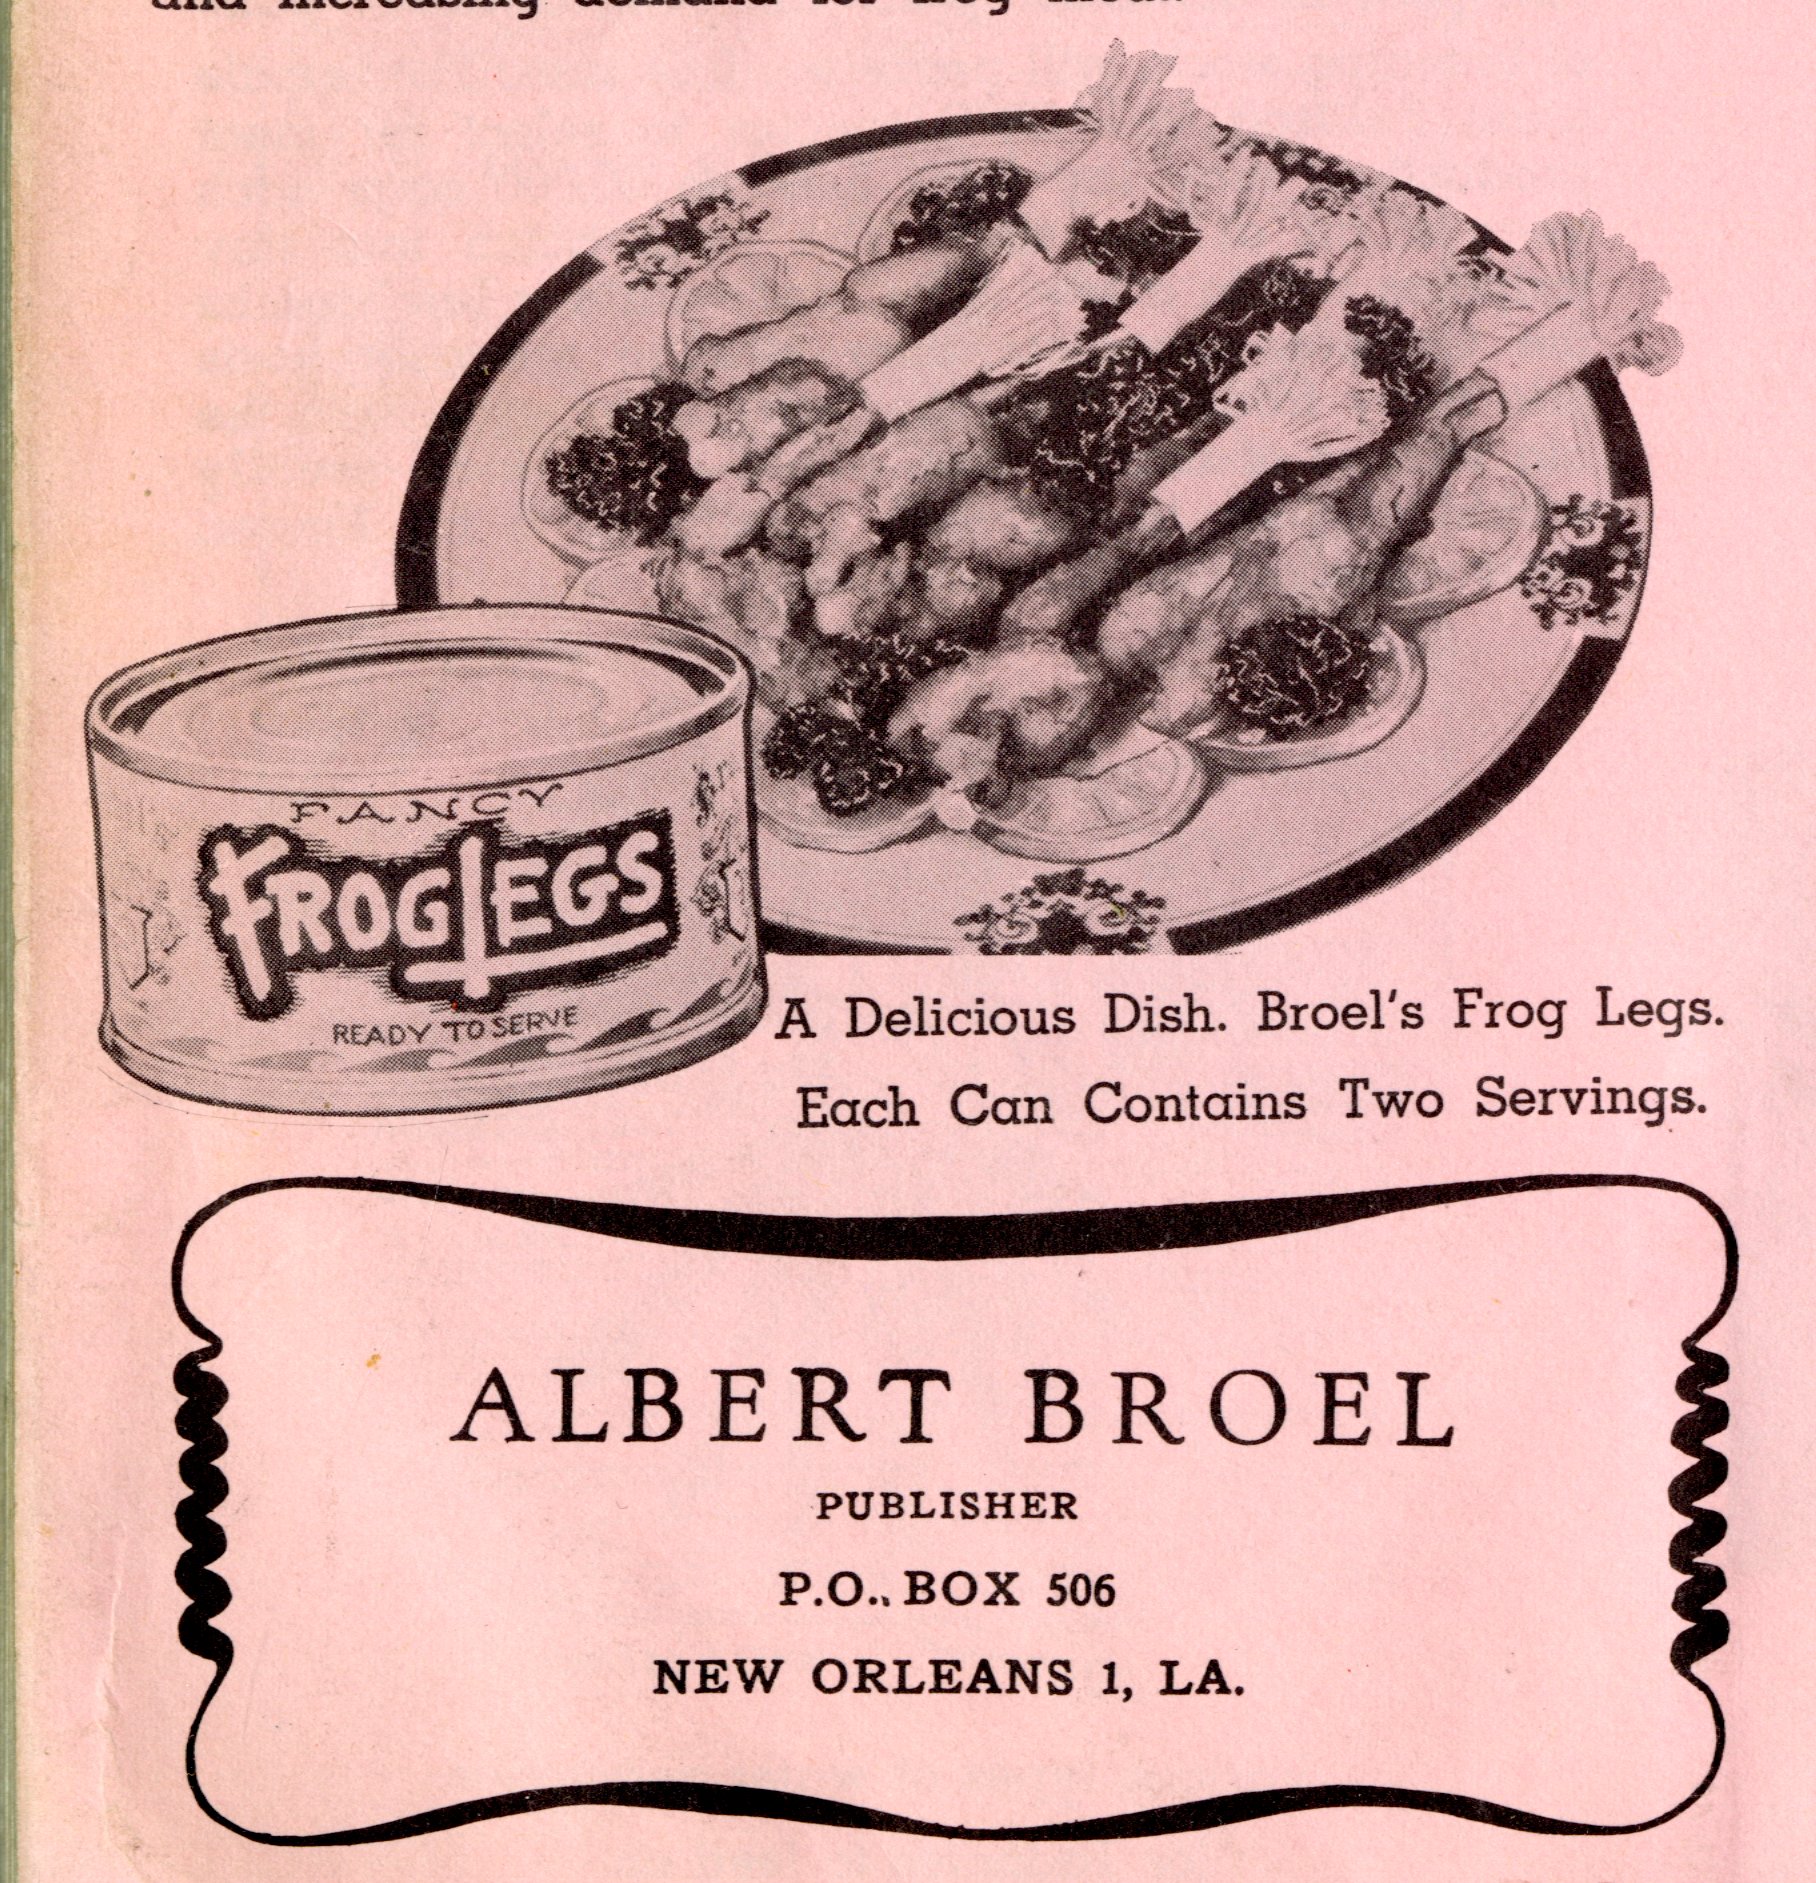
Americans have an entrepreneurial spirit, and during the Great Depression of the 1930s people were looking for a way to make money, and advertisements for raising frogs looked promising. Albert Broel, the founder of the American Frog Canning Company and author of “Frog Raising for Pleasure and Profit” promised a steady stream of income and all you needed was a small pond and a few pair of breeders to get started. Broel said that frog farming was “perhaps America’s most needed, yet least developed industry.” Broel’s lessons for one dollar per chapter or $14.95 for all 22 chapters, included details on habitat, breeding and canning in order to prepare giant bullfrogs for market. It also included tasty new recipes.
Broel came from Europe after World War I, settling in Detroit to practice naprapathy, a holistic wellness field, but was dismissed from the medical profession for practicing without a license. He moved to Fremont, Ohio and started growing frogs on a 100-acre farm, experimenting with canning frog meat. Broel incorporated his company as American Bullfrog Industries with promises to employ more than 100 people. The company produced its first canned frog legs in January 1933, but by April, Ohio state agricultural officials declined to license the facility and Broel moved his operation to Louisiana. He purchased 12 acres and built a cannery and slaughterhouse, and several acres of frog ponds. A pair of large frog statues with electric lights for eyes greeted visitors and the complex became a tourist attraction.
 Broel made a success of his frog canning company and his printed lessons on frog farming. In the 1930s, he was advertising in newspapers and magazines throughout the country.
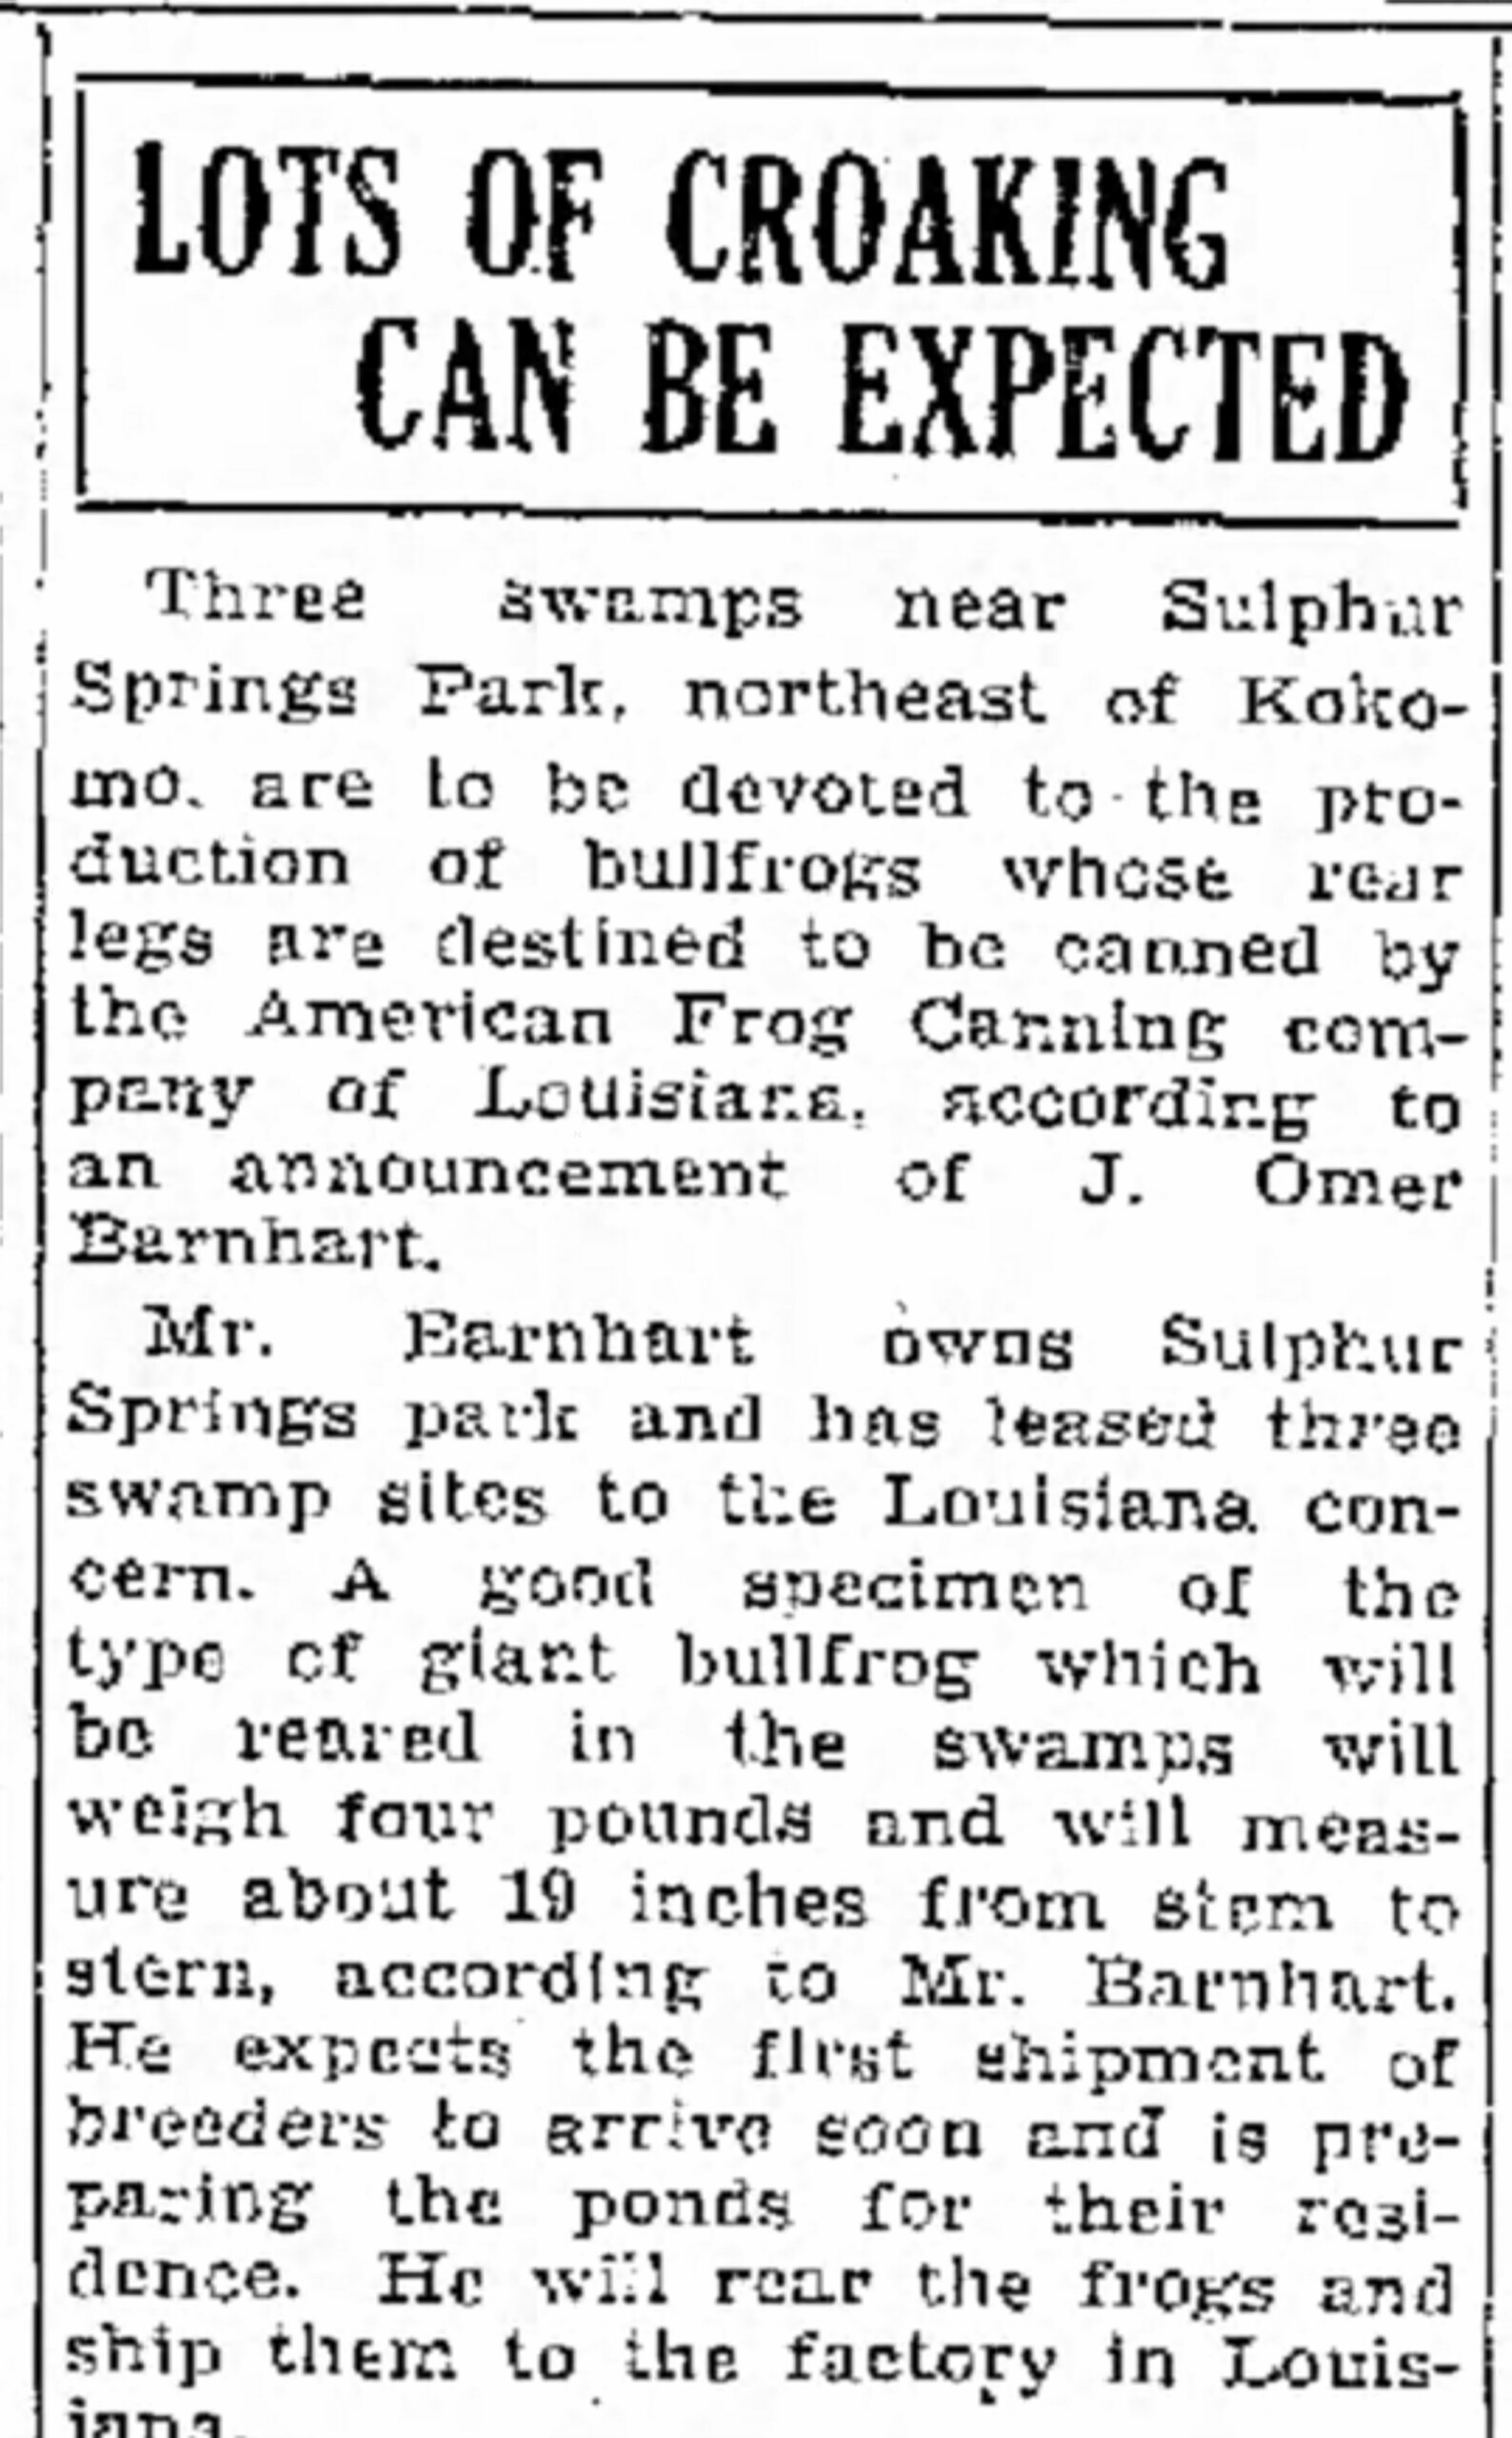
The Kokomo Tribune reported in 1935 that “lots of croaking can be expected” at swamps outside the Indiana city, where a local breeder was to start raising frogs to sell to Broel’s cannery.
 The Tampa Daily Times reported in 1934, that “If you have never eaten frog meat you have a real treat coming to you because it is somewhat like the breast of chicken, only many folks think it is much more tasty and digestible.”
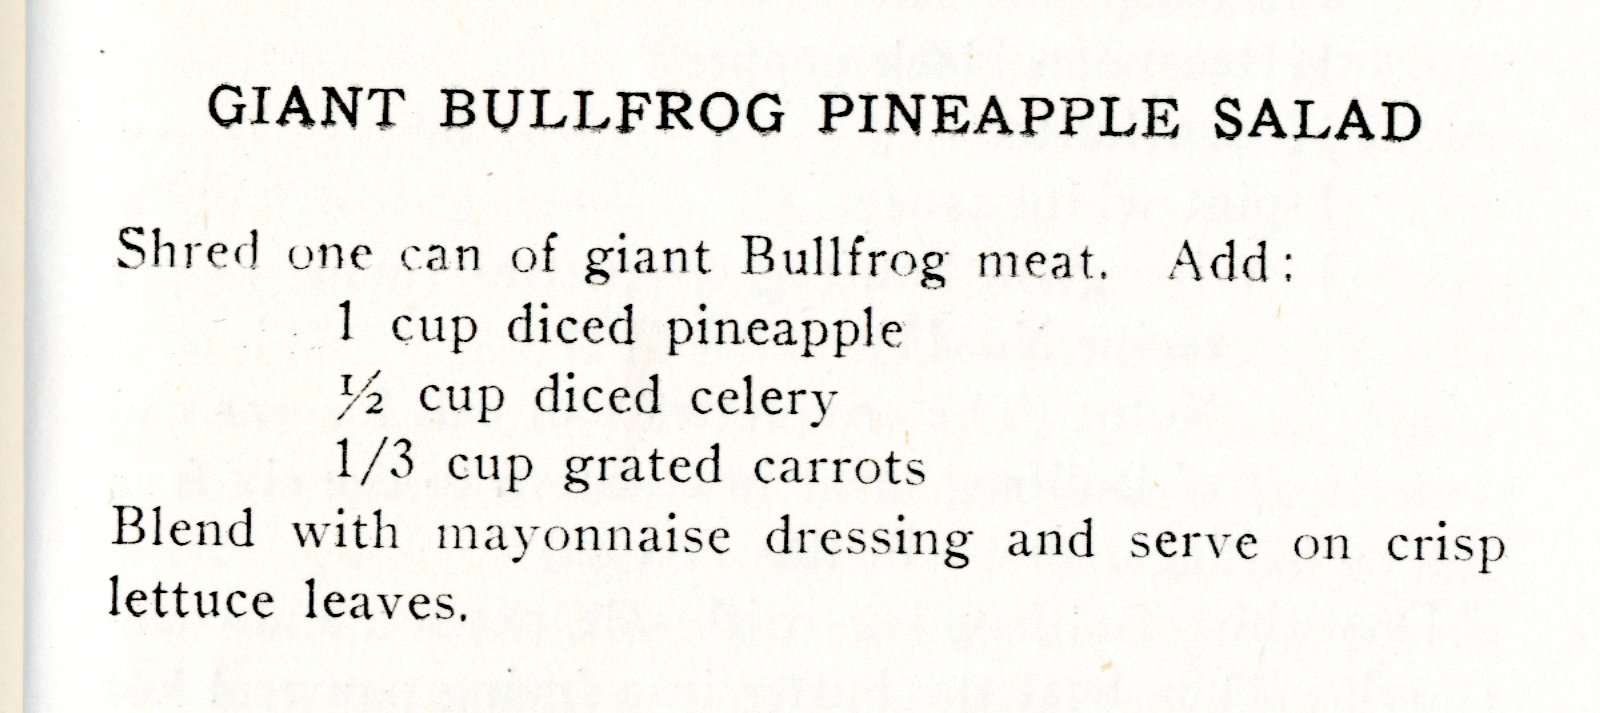
In what the New Yorker called “the frog-farm craze of the thirties”, Broel was a giant. He canned frog legs for market and dreamed up recipes all which he included his lesson plans. There were delicious treats like baked apples with bullfrog meat and American giant bullfrog cocktail.

The Frog business was profitable for Broel, but not as easy as he advertised. Broel stated that a few pairs of breeding bullfrogs would produce tens of thousands of tadpoles and in one generation the frog farmer would have enough to sell to canneries. But raising frogs is labor intensive and requires more than just a pond for the frogs to live in. They are actually fragile amphibians, vulnerable to disease and easy targets for predators, like birds and snakes. Frogs only eat live prey so frog farmers need to have a supply of minnows, bugs or something else that can be kept alive to feed to their frogs. Frogs will also eat their own tadpoles, so larval, and young frogs often need separate ponds to prevent larger frogs from eating the new stock. It takes about 1.15 pounds of live prey to produce a bullfrog with legs big enough to can. In 1934, the Missouri Department of Agriculture estimated that imported frog meat costs between $2.70 and $3.20 per pound, while domestically farmed frogs can cost up to $12.70 per pound to raise.
In the mid 1930s, the U.S. Postal Service indicted Broel and his employee, Sylvester Schutt, for mail fraud and the Federal Trade Commission also ordered Broel to cease and desist from making what it called misleading claims in his frog advertising. They were accused of falsely stating in marketing materials that frog farmers who paid for their course could make more than $360 billion.
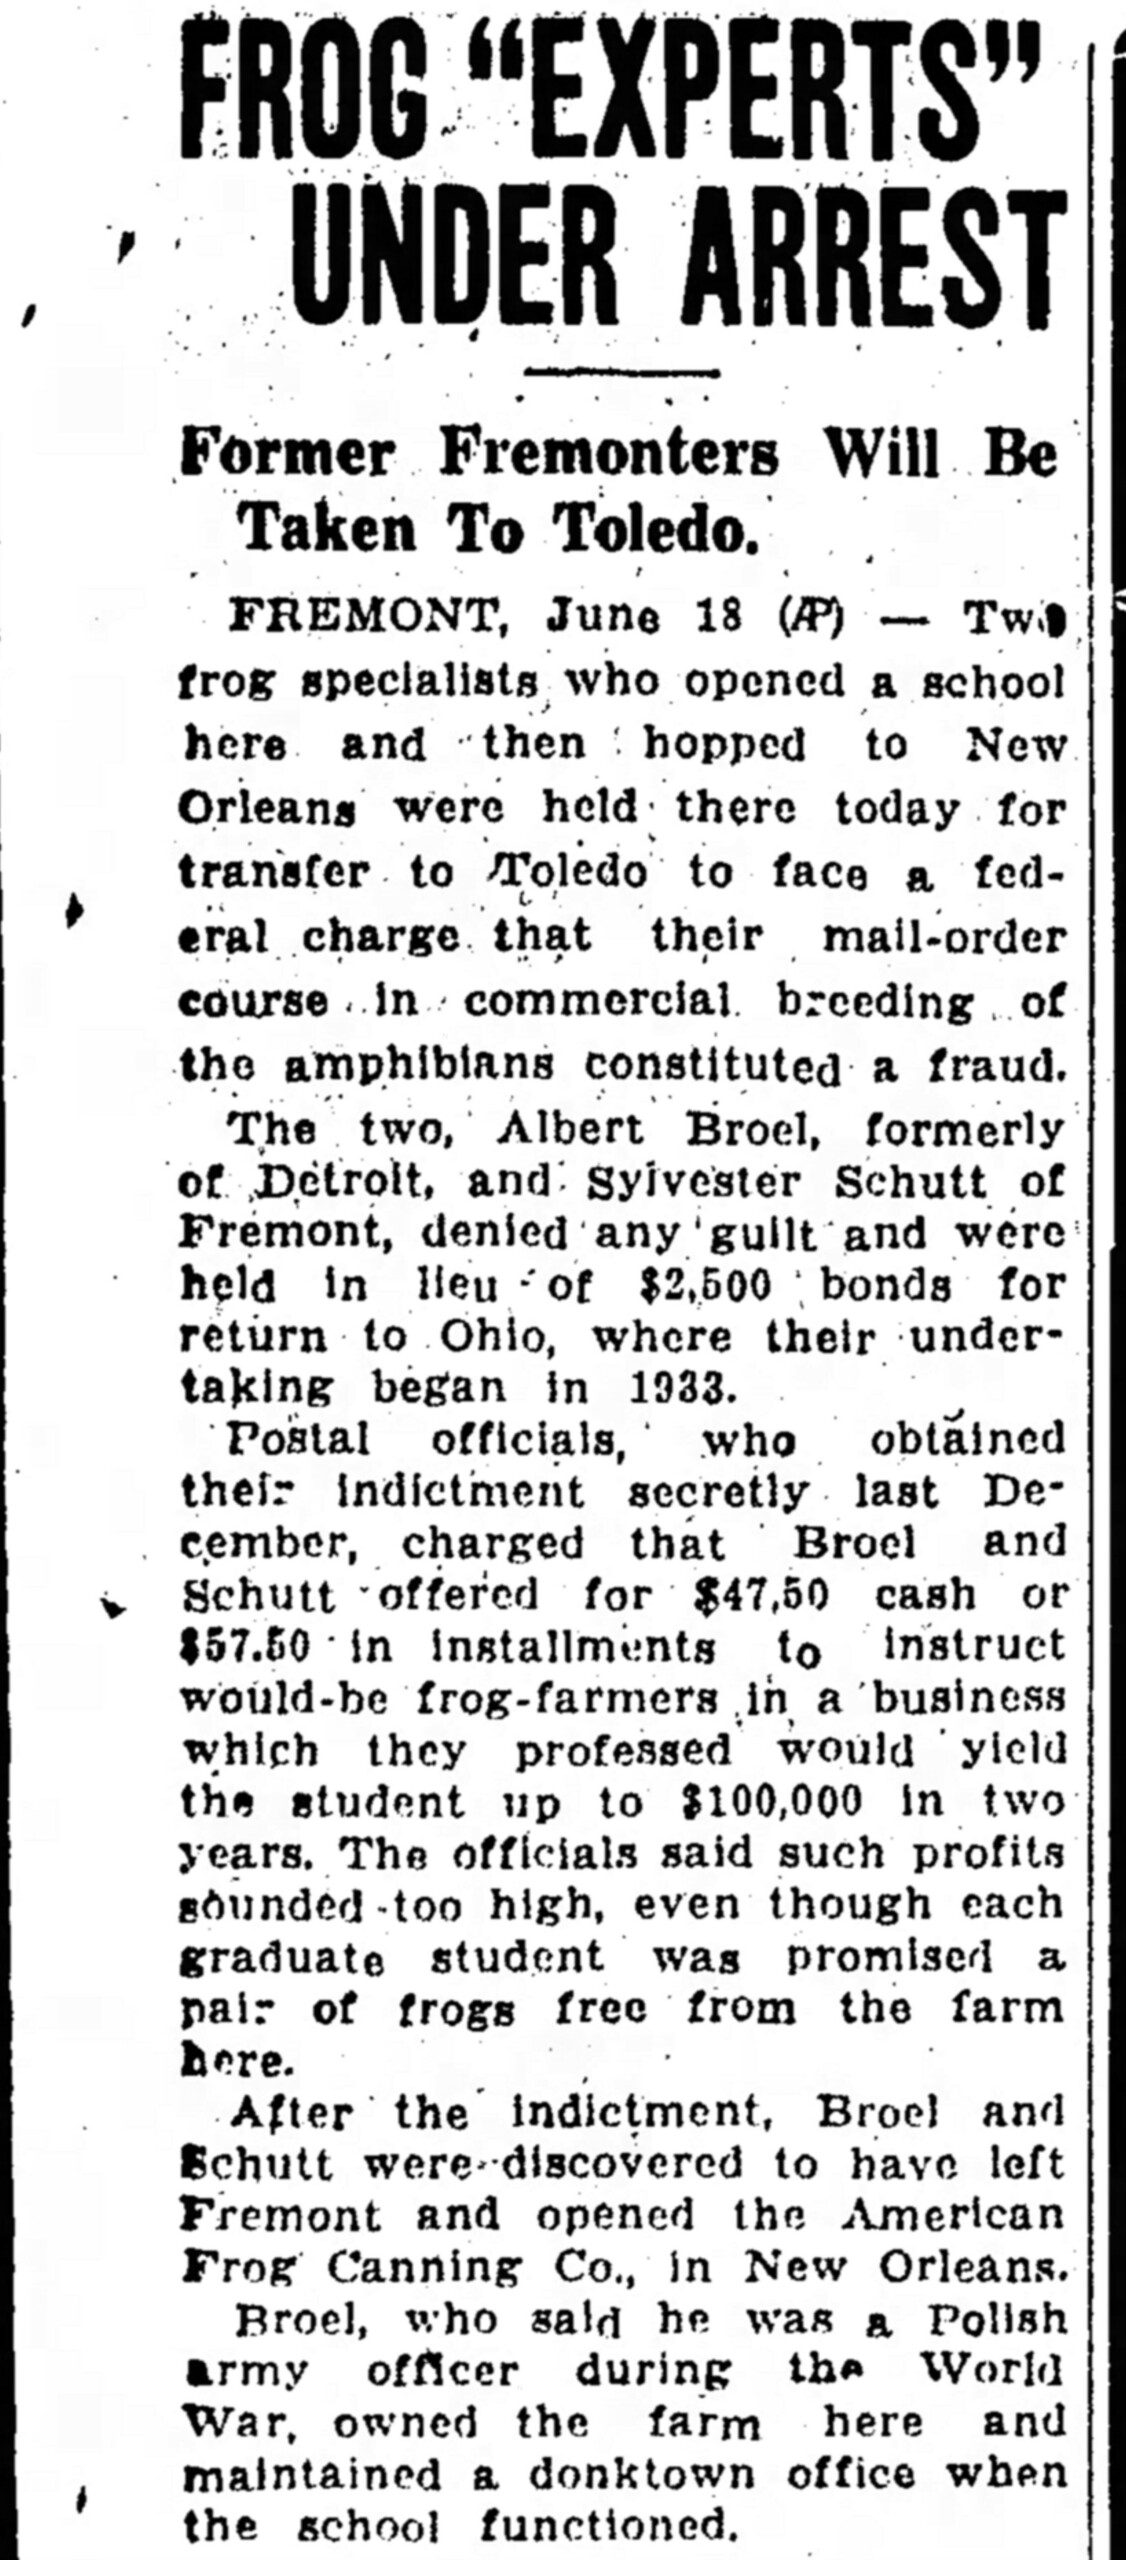 Broel sent a letter to an Ohio newspaper, The Fremont Messenger, denying the charges and taking “entire responsibility for all matters connected with literature disseminated by the American Bullfrog Industries.” Eventually, all criminal charges were dismissed, and Broel entered into a settlement with the FTC, agreeing to stop saying that a certificate from his course made someone a “qualified frog culturist,” and to stop sayin that frog meat could cure certain diseases. Despite the bad press, Broel’s ads still appeared across the country, and he continued to operate the cannery for a few more years. By the late 1930s, Louisiana law prohibited hunting frogs in April and May, reducing the number of frogs available for Broel’s cannery. He shut the cannery down citing health issues and the difficulty of getting enough frogs. Broel’s daughter, Bonnie Broel, wrote in her 2007 memoir “House of Broel: The Inside Story” that Broel continued selling breeder frogs. “We knew that if there were brown bags in the fridge, there were frogs in there” and “If I couldn’t take a bath there were frogs in the bathtub.” Bonnie Broel also stated that eventually her father sold the land, using the money to buy real estate in Detroit, where he retired.
 This blog post was written by Marcia Caudell, supervisor of the Reference and Government Services Division at the Indiana State Library.

 Perhaps, it is realism you are after. Check out the Smithsonian, a great place to collect photographs of wildlife and other gems.
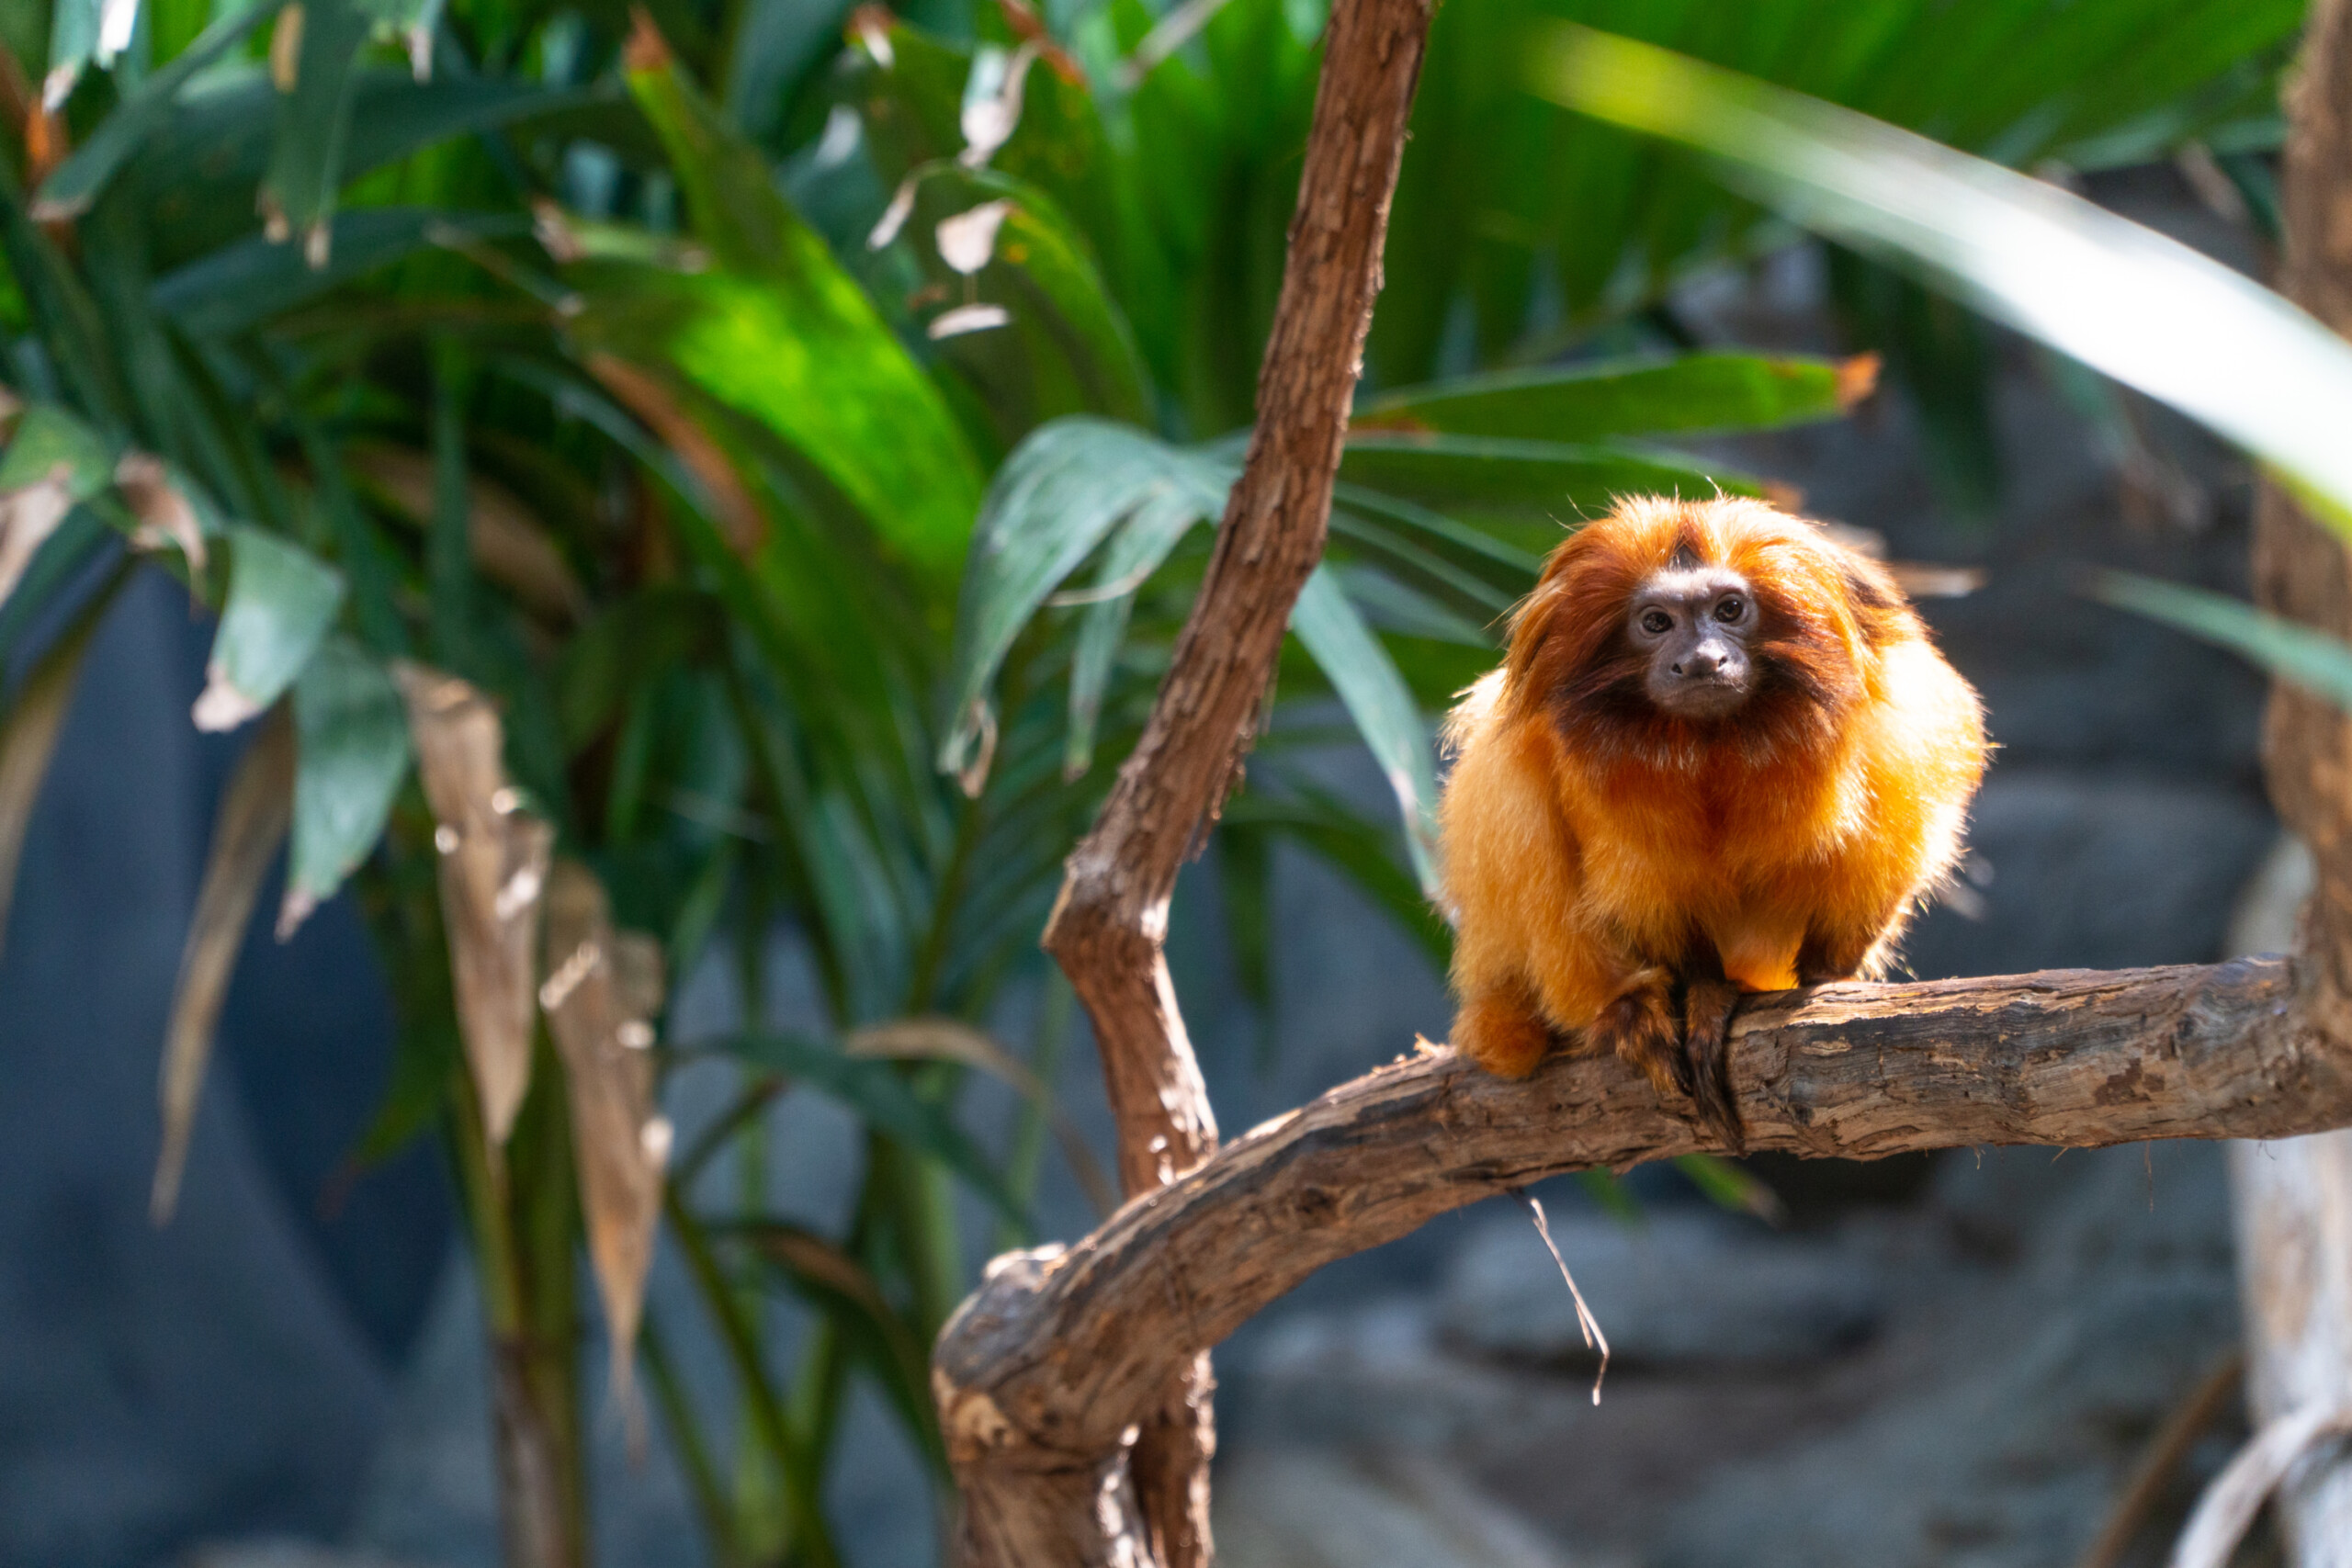


